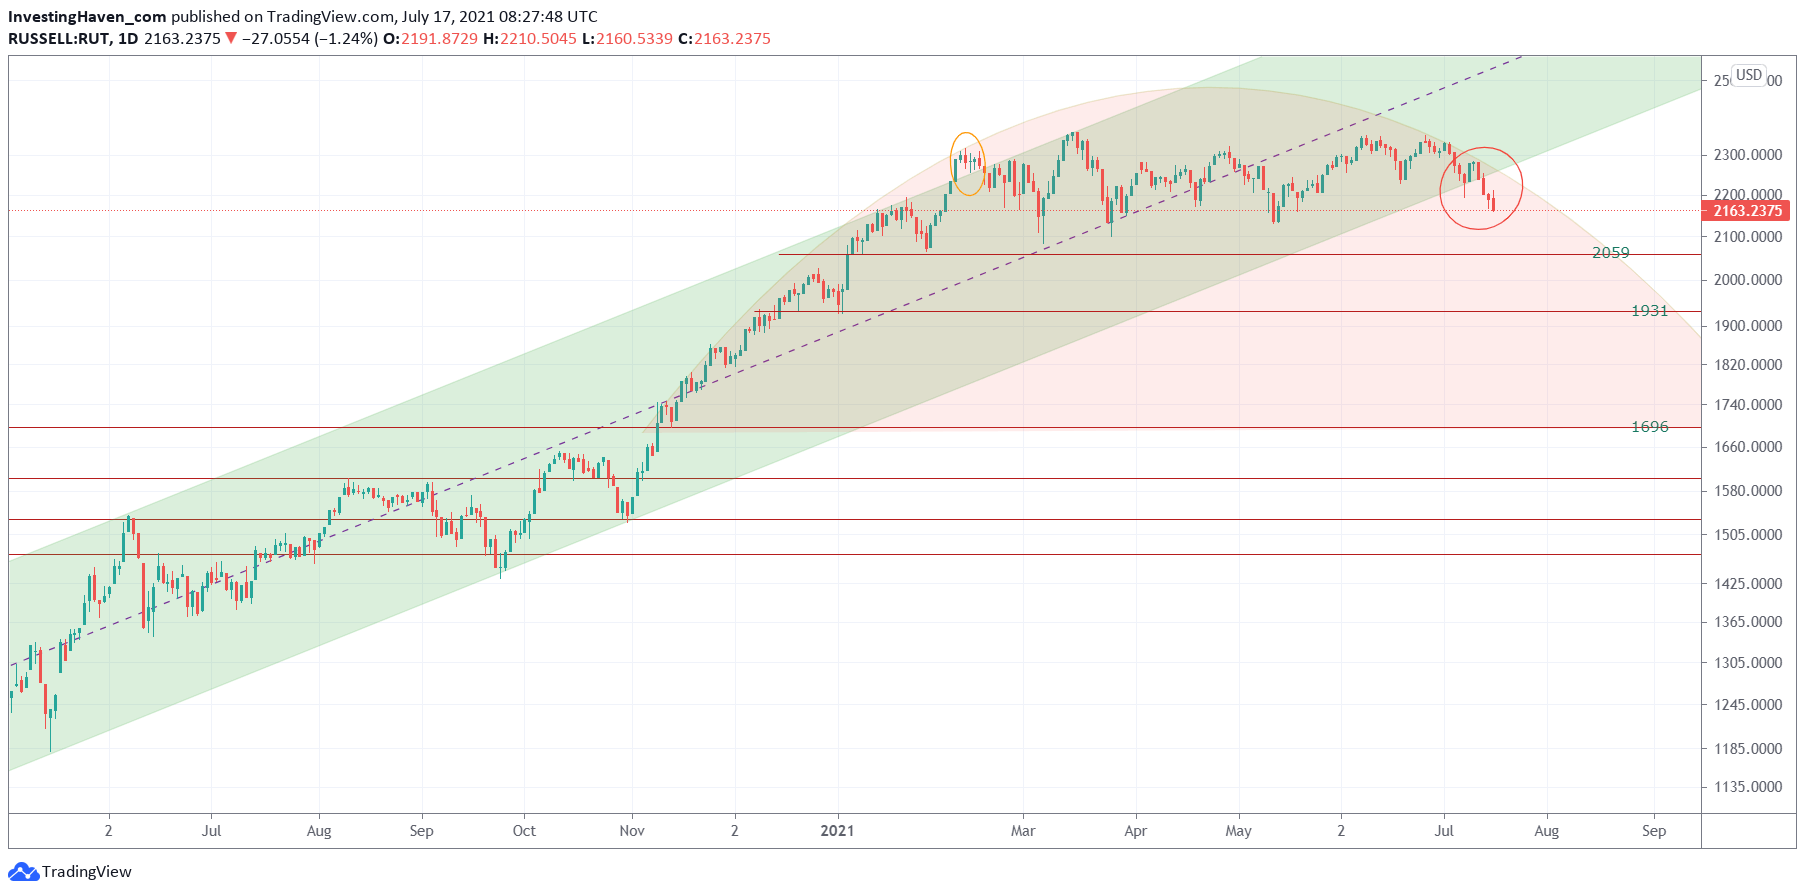
The most concerning chart is the one from the Russell 2000: it is a breakdown in the context of a bearish rounded topping pattern. It is not pretty, but understanding it’s impact (without over-doing it) is crucial for investors. It is pointless to panic, it is crucial to understand.
First of all, we have to stress that the market already hit our bullish stock market target especially as explained in our A Dow Jones Forecast For 2021. This market is ready to cool off.
In the end the market already did cool off. That’s not a conclusion you would draw if you look at indexes because they are at or near all time highs. But indexes did tremendously well simply because the stocks with the highest weight outperformed the rest of the market.
And this really is how we would characterize 2021: a bad year for most stocks, only a few select sector or even individual stocks might have done well. But all trends are capped, and all momentum is taken out of the market after a short period of time!
And this is set to continue! That’s the bad news. The one chart below makes this point.
Small cap stocks are the ultimate barometer of risk sentiment. This breakdown clearly suggests that the market is confirming lower risk levels.
The Russell 2000 came down 10% in the last 2 weeks. As per horizontal levels on the daily chart below we expect a further 4.6% decline to 2059 points followed by a decline to the 1970 target which is in total 10% from current levels.
Does this mean a crash is underway?
Not necessarily, even though it won’t be pretty for small cap stocks. More importantly, this Russell 2000 chart clearly suggests that (a) choppiness is here to stay for a while (b) most sectors will not create momentum (c) hardly any sector will create momentum (d) only a very, very few number of sectors might do well in the 2nd part of 2021.
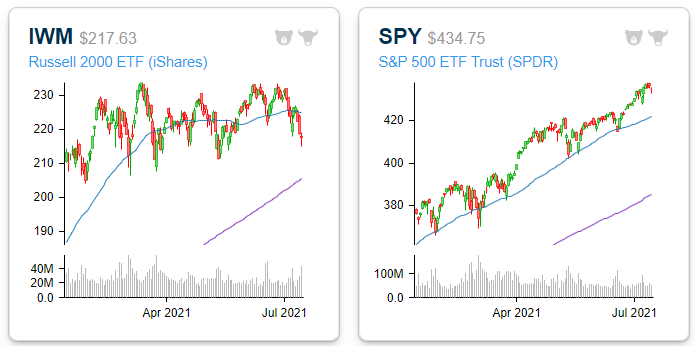
Our friends over at BespokeInvest featured this interesting chart this weekend which shows the divergence between small caps and large caps.
What’s the broader message of above charts?
If the market stopped each and every momentum trend in the first part of this year we can know for sure that it will continue to happen in the short to medium term. No trends for the largest part of 2021, trends are all short lived. Forget momentum, forget big profits in the short to medium term.
Investors will come back to earth. Investors better set expectations right: late this year or early next year is when big things will happen again.
Frustrated by the market and lack of momentum? Even more frustrated about the above charts which confirm lack of momentum for many more months? We worked out a solution, and it is a passive income solution because of auto-trading. Maybe you should consider the breakthrough in our research as explained in great detail in Auto-Trading And Micro-Opportunities: The Ultimate Answer To Complex And Frustrating Markets.


