The market did exactly what we expected it would do. As described 3 weeks ago in this public post Is Apple About To Lead The Nasdaq Lower In September we got a pullback in markets. It was an obvious one, everyone could see it coming. The million dollar question is where markets go from here.
Here is one angle that we find incredibly useful: reading volatility indexes are they have predictive value. As explained in our latest volatility update This Volatility Index Suggests A Short Term Bounce In Markets May Be Underway:
Based on the current setup of the short term volatility index featured below we would argue that a short term bounce is underway. The pullback has likely run its course.
We tend to use volatility indexes as a market read, a leading indicator, to complement chart readings of leading indexes like SPX and the Nasdaq.
A few weeks ago, we signaled that the Apple chart would lead the market lower. It happened, as expected. The lows of Apple, set on Thu/Fri, were 154 USD. This is what we wrote in August:
The support level that will be tested is 151-156 USD. That’s a 12% pullback. This will drive both the Nasdaq and the S&P 500 lower with at least 6 to 8 pct. Ultimately, 140 USD should hold, is what we are thinking.
While this is a serious pullback, it certainly qualifies as a healthy and much needed pullback.
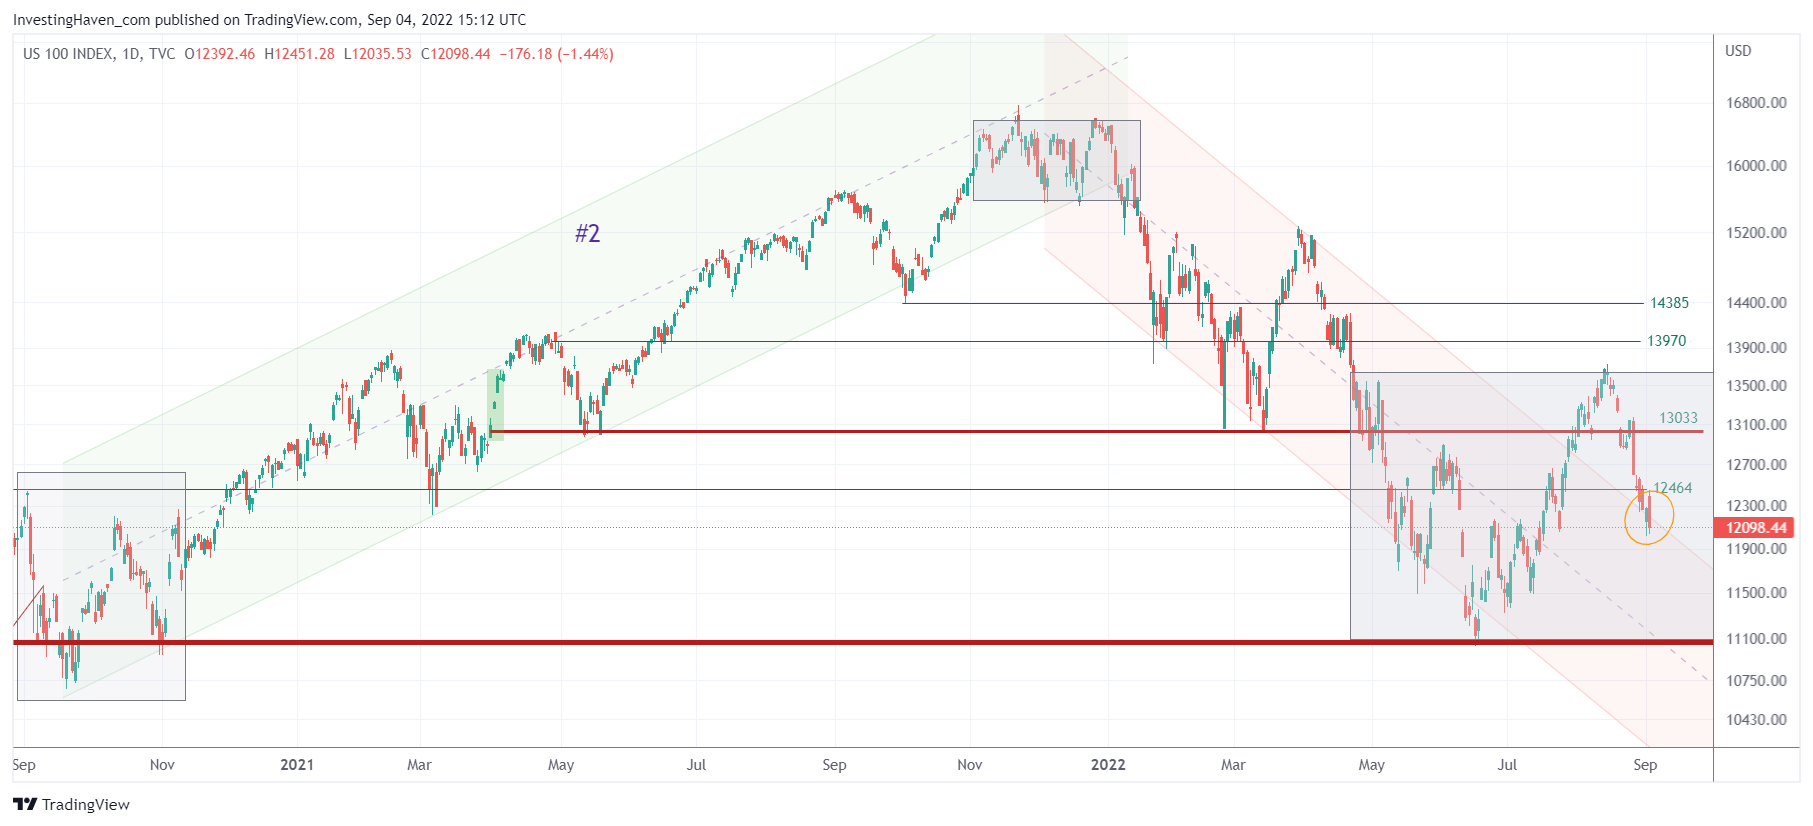
There is a third angle that we tend to use to read the market: the Nasdaq chart featured below. This one signals a very interesting message: it has doubts whether it should be in an uptrend or in a downtrend. It is trying to stay away from its H1/2022 downtrend, but bears are pushing. At the same time, bulls are preventing it from re-entering its downtrend structure.
We now have very clear readings: volatility indexes, the Apple chart and the Nasdaq structure confirm each other.
The short term volatility created in 2022 is very tiring. We recommend staying focused on the big picture. This is what we see big picture (commentary is based on the daily Apple chart):
- IF our expectation is right, we can reasonably conclude that 2022 was a base building year, characterized by violent swings (in both directions). This sets the stage for a major breakout and bullish trend in 2023.
- IF our expectation is wrong, we will see a major and bearish M-pattern in 2022.
Remember, growth stocks are among the most profitable segments of the market when they are in an uptrend. That’s why we continue to cover the Nasdaq chart.
In our Momentum Investing service we hunt for opportunities in specific segments in growth stocks. We do so with a shortlist with stocks that we expect to be explosive in 2023, provided the Nasdaq chart turns constructive, because (a) they are part of a mega trend (b) they are consolidating in 2022 with the intent to break out in 2023. In Trade Alerts we don’t care about the Nasdaq or individual stocks because we simply play short term trends, bullish and bearish. Many of our members even don’t care about the buy/sell signals because they outsource their headache to our team as they signed up to our full auto-trading service.