Last week probably qualifies as one of the most violent weeks in recent history of markets. A lot of damage was created, many investors threw in the towel… probably did so near a bottom. While we cannot be sure that the bottom in markets was set on Thursday, we have this one leading indicator that is suggesting there is a high probability that a bottom is set now. We are talking the Nasdaq volatility index, not popular which is why it’s useful. We explained how it works in Forecasting Markets: This Is How We’ll Know If Stocks Will Be Bullish vs. Bearish.
First of all, we go back to the article we wrote a week ago: May 9th Is A Crucial Day But Not In A Way You Would Expect. We shared a few really important insights, even in the public space, but with much more detail in our premium service Momentum Investing which helped us stay calm during a very violent week. Here is the point: the better you understand markets and their dynamics, the better you can understand big selling events, the more balanced and less stressed you will be going through extreme periods like the one we are going through currently. This is what we wrote in the article mentioned above:
Here is how it works: some leading indicators or some leading indexes tend to print an important ‘chart event’ on those days. Think Sherlock Holmes, you have to filter out relevant data points from irrelevant data. You then have to start connecting the dots. Some things are clear immediately, some need up to 8 weeks to get clear.
Tip: currencies are testing multi-year support/resistance levels, bond yields are testing multi-year resistance levels, the S&P 500 is testing multi-year support levels. Could the picture be any clearer? May 9th, 2022 should be a turning point, the only question is in which direction.
It happened, a big decline followed by a potential bottoming formation on Thursday, in the week of May 9th.
In the weekend updates shared with premium members we bring up this 6 month cycle in great detail. We also made clear that we will follow up, in the coming days and weeks, what we believe the impact will be of ‘chart events’ that will be printed tomorrow, May 9th, 2022.
The insights we shared with our premium members is epic, also timely, still very relevant not just for next week but for months and years to come.
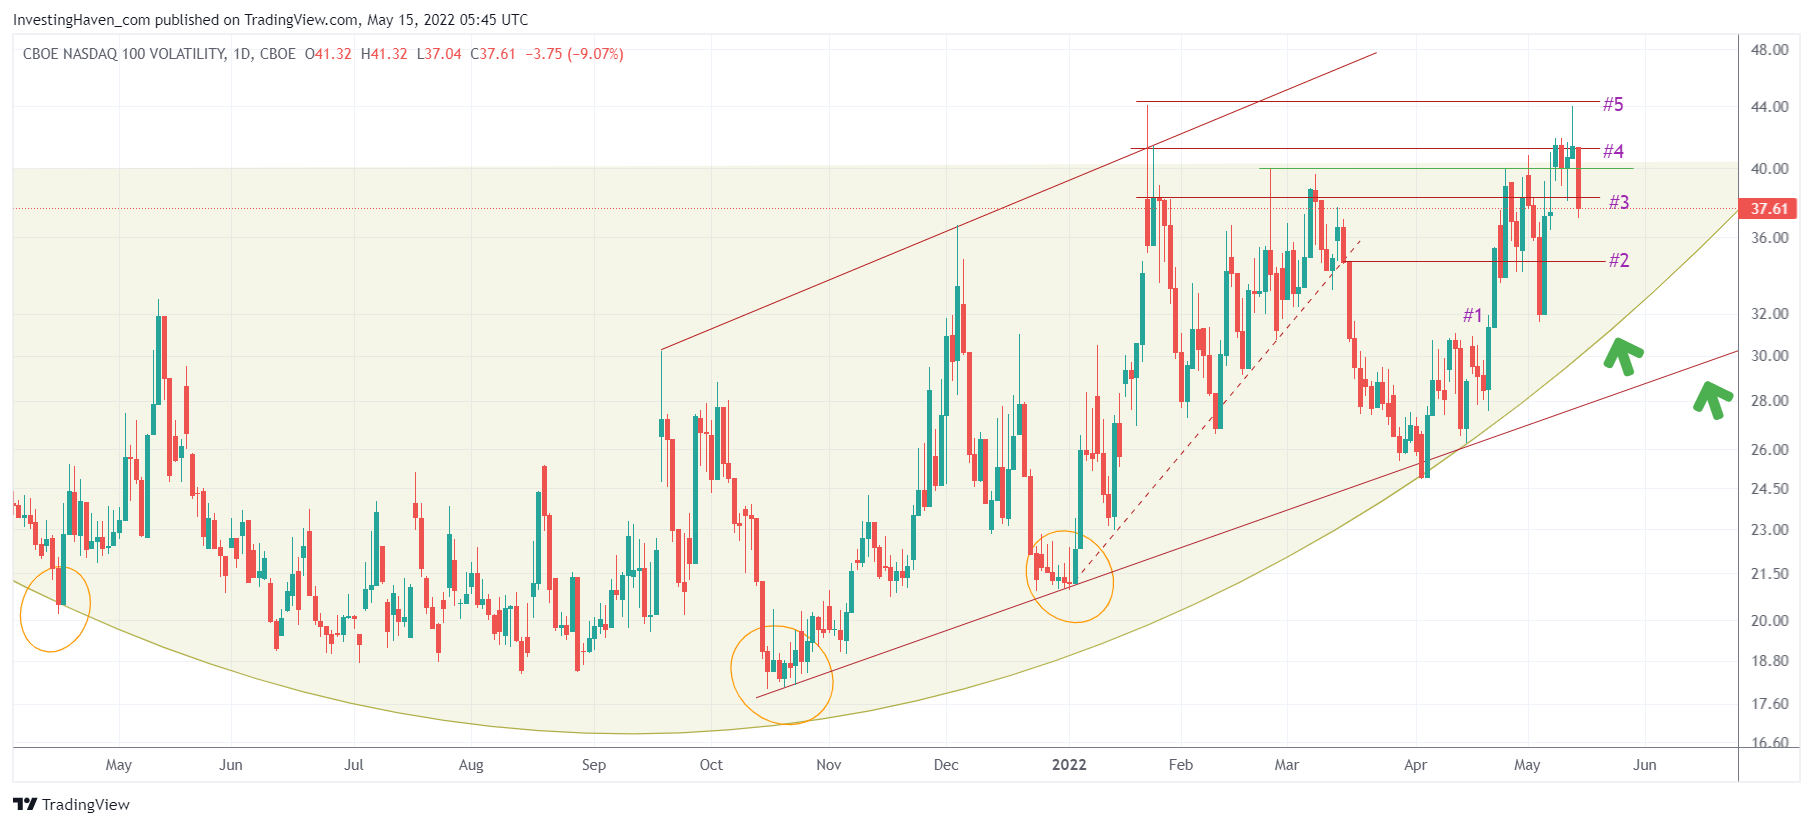
Back to the forecasting ability of this one leading indicator: the Nasdaq volatility index.
Look what happened last week: after five consecutive days to try and clear point #4 on our chart, which was the crash level we indicated, this indicator failed to move higher (inverse correlation with the Nasdaq).
Also, look how clear the topping pattern is that was set last week, the week of May 9th. No coincidence.
What is this leading indicator suggesting? A bottom was set last week, we would even argue this is a valid forecast with a high level of confidence. Remember, the Nasdaq was the driver for selling in the last 5 months. Whenever the bleeding in the Nasdaq comes to an end, the entire market will rebound. In a way, the indicator below has a forecasting ability for the entire stock market. Note that we feature 6 such volatility indicators in our weekend analysis shared with premium members of Trade Alerts, a pretty unique way to look at markets.