After a few really strong weeks in markets it is clear that a retracement is required. We can easily see this on the chart of leading indexes. But here at InvestingHaven we have developed a crucial component in our methodology which is all about reading volatility indexes as leading indicators to understand future price direction.
In our Trade Alerts weekend edition we feature 6 distinct volatility indexes. They help us understand what to expect from markets, especially the S&P 500.
In this short article we feature 3 volatility indexes (out of the 6) to illustrate our methodology.
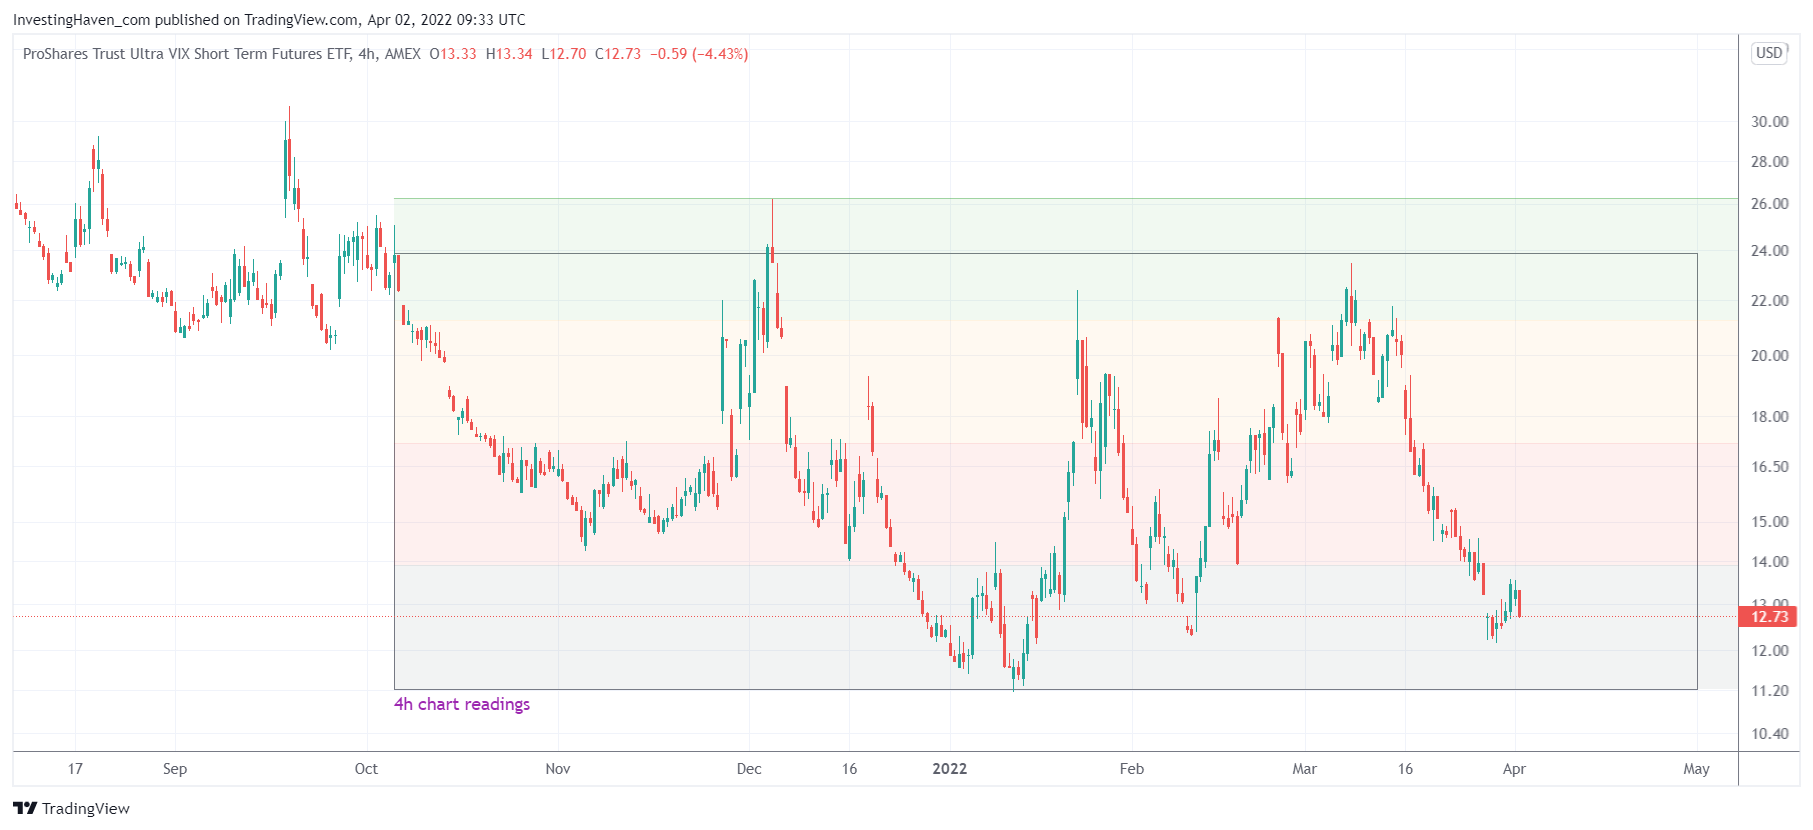
The short term volatility index on the S&P 500 is near support. The most likely outcome is a bounce from here (retracement in markets). We can only expect a bullish run in markets once this short term volatility index breaks down. For now, we expect volatility to pick up (markets to retrace) until it hits the red/yellow shaded area.
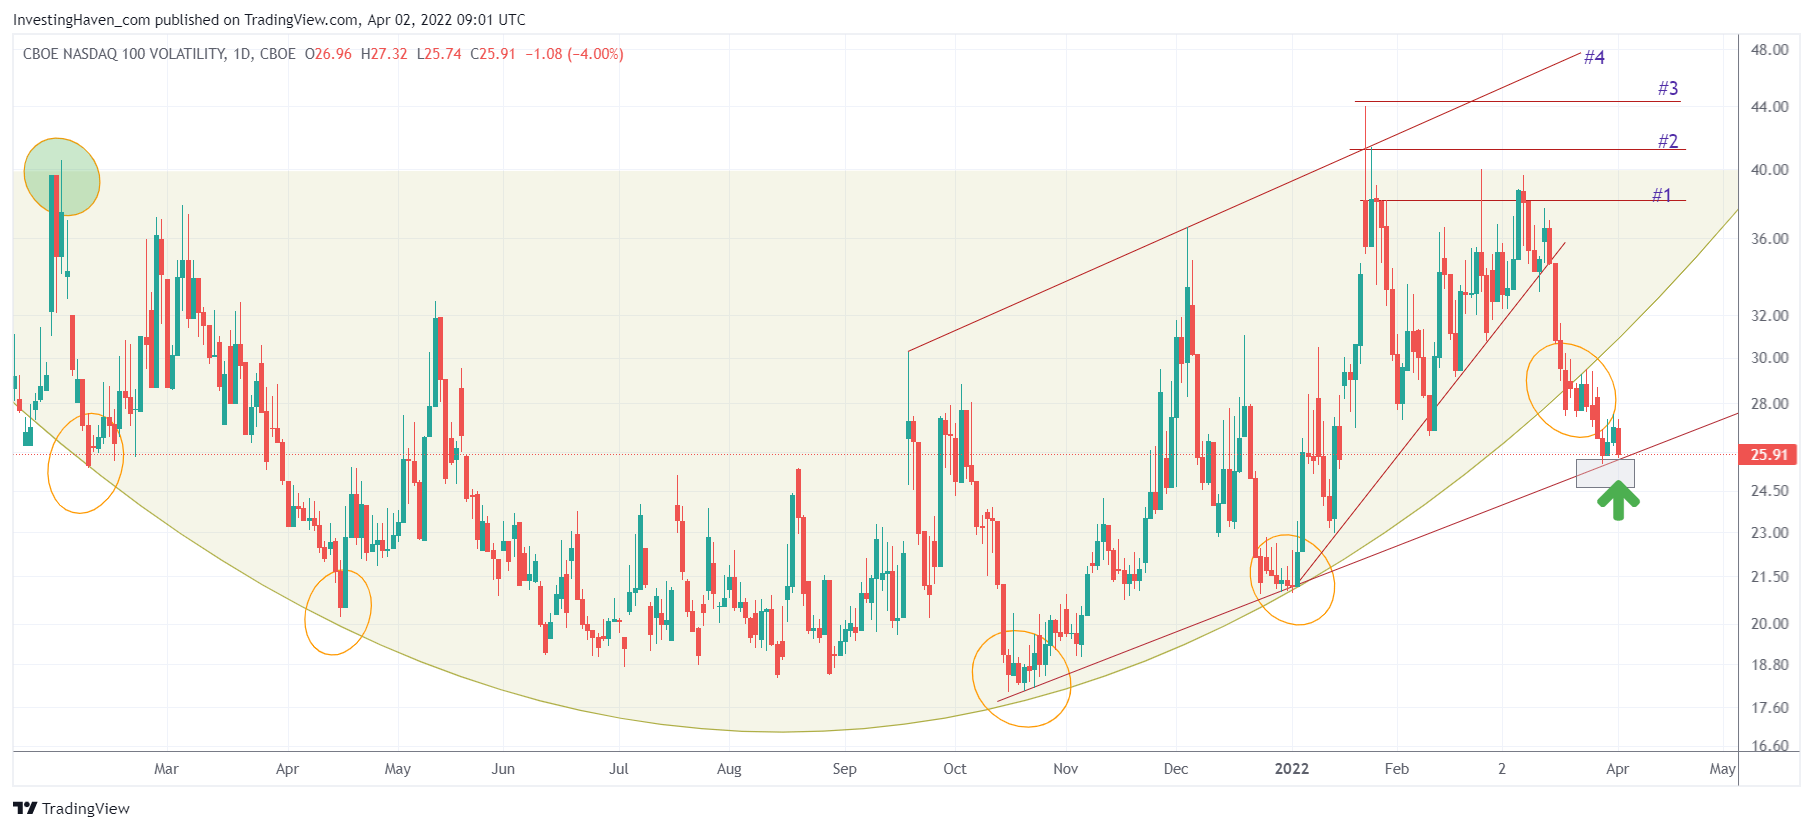
The Nasdaq volatility index which was the driver of the recent sell-off (in fact, the driver of selling since mid-November) came down exactly to the point we indicated a while ago: the green arrow. There is only a real trend change in the Nasdaq (confirmed bullish trend) once its volatility index falls below this rising trendline indicated on below chart. Whenever this happens, we know for sure that markets resume their uptrend.
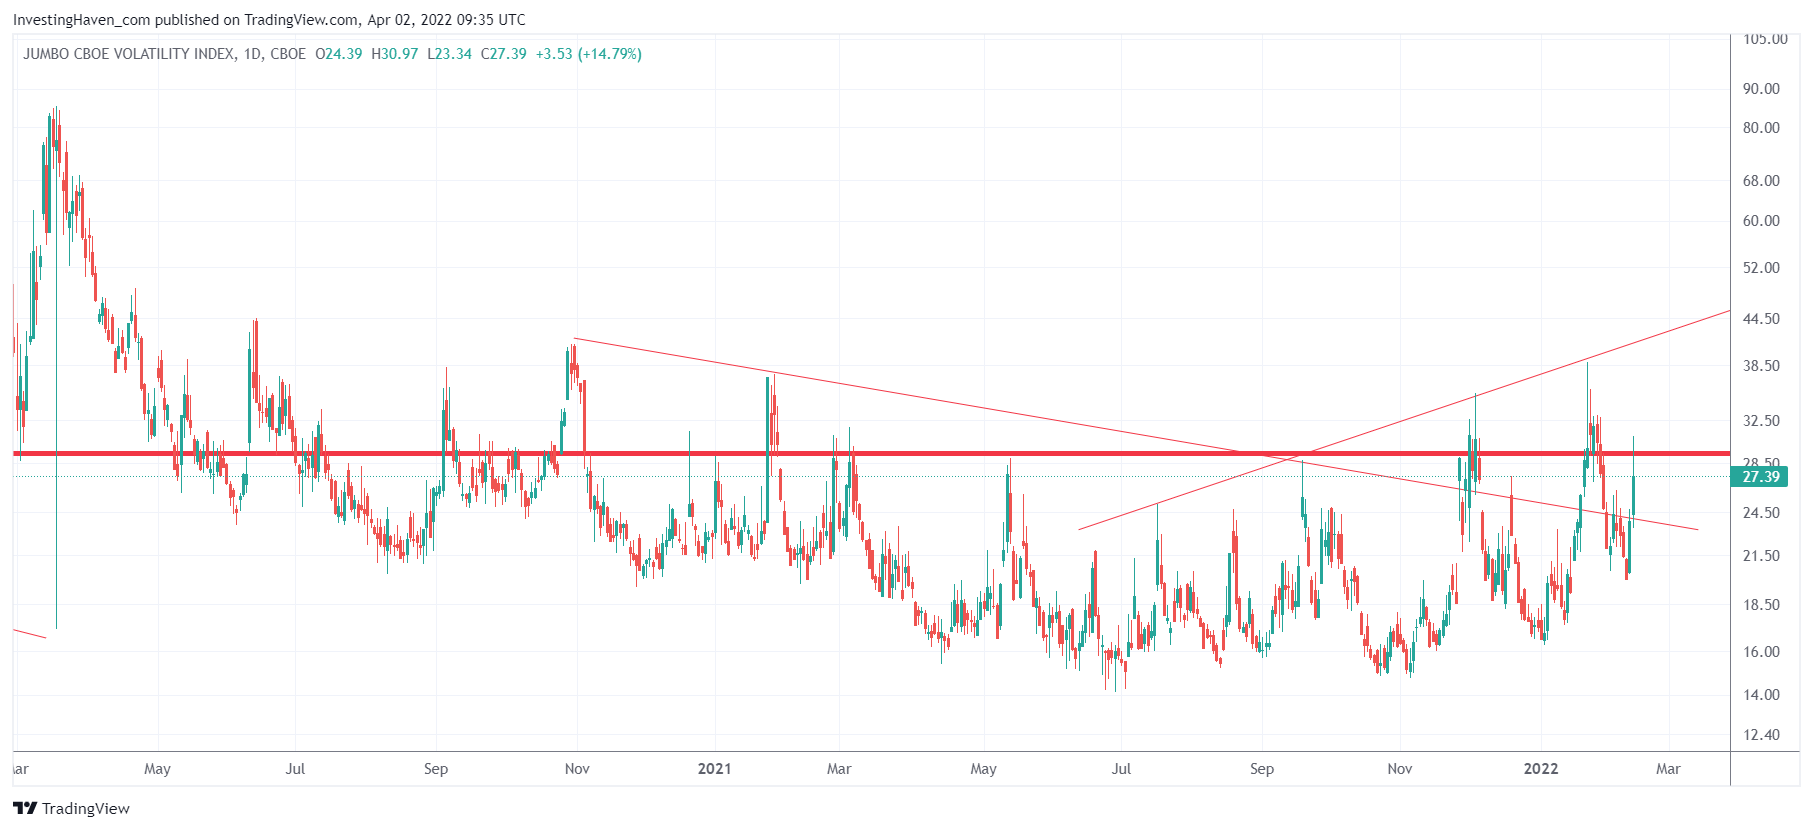
The longest term volatility index on the S&P 500 is right now in the middle of nowhere. However, there is a potentially mid to long term uptrend as seen on the higher highs set since last September. We read this index as potentially dangerous.
Conclusions (this is an excerpt from our Trade Alerts weekend alert):
- The Nasdaq has not confirmed a trend change, as of yet. Not bullish until its volatility index structure breaks down. This has important implications for stocks in general because the Nasdaq has been the driver of volatility and selling since last November.
- General volatility has come down and is hitting rock solid support.
- The next 4 trading days will be telling [for reasons shown on two other volatility indexes not included in this article)]
We expect either an after shock OR a quiet market. Maybe, we’ll get an after shock followed by a quiet market. By next Friday, we should have good insights about the intent of this new cycle.
This is an excerpt from our Trade Alerts weekend edition. We posted 3 from the 6 volatility charts as well as the conclusions. We are convinced this analysis helps us understand turning points, local tops and local bottoms. If you like our work you can sign up for Trade Alerts and send us a message to get 3 months auto-trading the S&P 500 for free.
PS/ We want to let our followers know that we sent a donation to charity, our first 2022 donation. Last year, we supported 4 distinct organizations focused on children. The organization we selected for our first 2022 donation was founded by one of our premium members: www.housetogrow.org.


