We are a fan of JD.com, symbol JD, the 2nd largest e-commerce company in China. Exactly one year ago JD went through a turbulent period because of (sexual) accusations towards its CEO. Right after this the Oct/Dec 2018 decline started. JD got slaughtered, it lost some 70% in half a year. JD recovered, and million dollar question is if this internet giant is worth buying?
We kept on repeating to buy this stock on those giant dips:
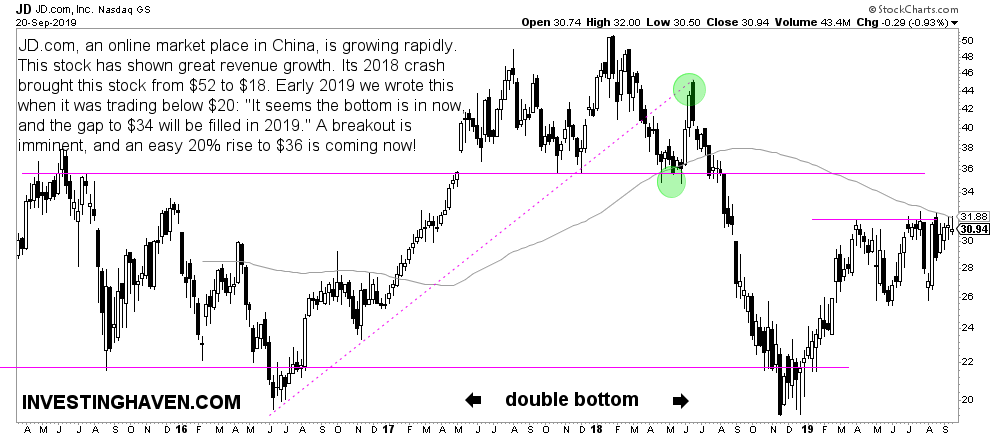
JD.com Stock Price Shows Giant Double Bottom, 45 Pct Upside Potential In 2019
And this summer we predicted a fast rise to the $36 area which has not materialized yet but pretty sure this will happen soon:
Favorite China Tech Stock JD.com Has An Easy 20 Pct Upside Potential
The reason we stay positive on JD is because of their solid financials: continuous top line growth. Check this.
Moreover, they keep on innovating.
When it comes to their chart we have 2 different charts: weekly and daily. Both have interesting insights.
The weekly chart below shows this major double bottom and current pressure cooker. It’s clear that $36 is coming.
Note that the reason there is so much hesitation at the current price level is because it coincides with the 90 WMA, the only technical indicator you will find on any of our charts. It has proven to be powerful for long term trends. Once above $31.88 we expect this quick 20% rise.
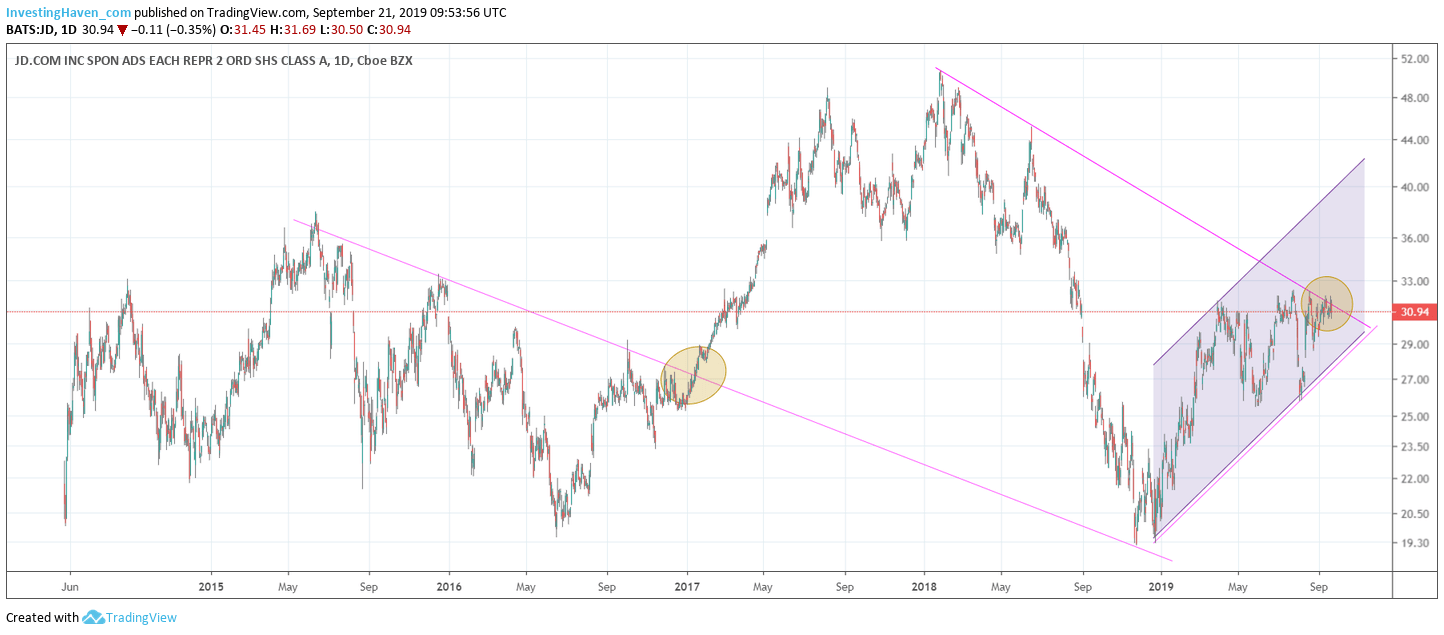
The daily chart is even more interesting.
We can identify this channel even though it’s not perfect.
Moreover, and more importantly, there is some sort of triangle formation in the last 24 months, and JD is right at resistance of this triangle now.
This happens to coincide with the 90 WMA shown above.
No coincidence it takes so long to break above $32.
Once broken out of the $32 area we expect this rising channel that started in 2019 to continue. That’s why we believe that JD will ultimately test the $45, maybe this year maybe early 2020!