The Future Direction Of Inflation – it certainly is one of those mysterious questions top of mind for everyone nowadays. From investors to consumers, everyone is getting hit in their pockets after gas and goods prices soared to levels never seen since the eighties. Are we able to forecast where inflation is going? If anything, we might have pretty shocking news for you.
Believe it or not, ‘out of hand inflation’ might have peaked for the year here. This assessment is based on some intermarket indicators and some key charts.
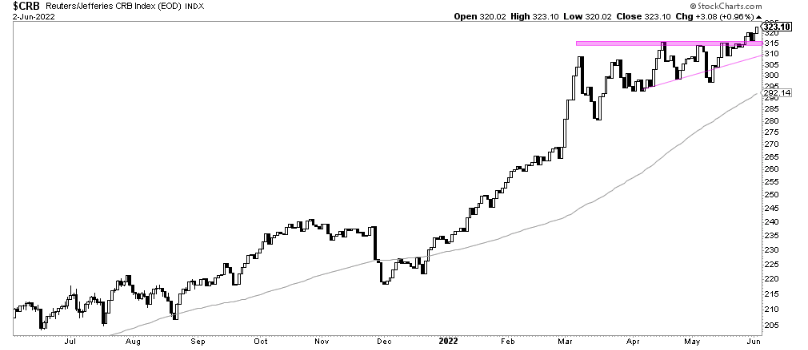
From an intermarket perspective, we have an over-extended upwards move in commodities that we have covered recently: Are global commodities markets about to top.
The chart below however, indicates that a breakout could be happening at the time of writing in commodities. We cannot take any bias here because we have seen so many fake outs recently that it’s best to stick to price levels. In this case, we have a valid breakout above $315 in the $CRB index and a failed breakout below that level.
What Is The Future Direction Of Inflation in 2022?
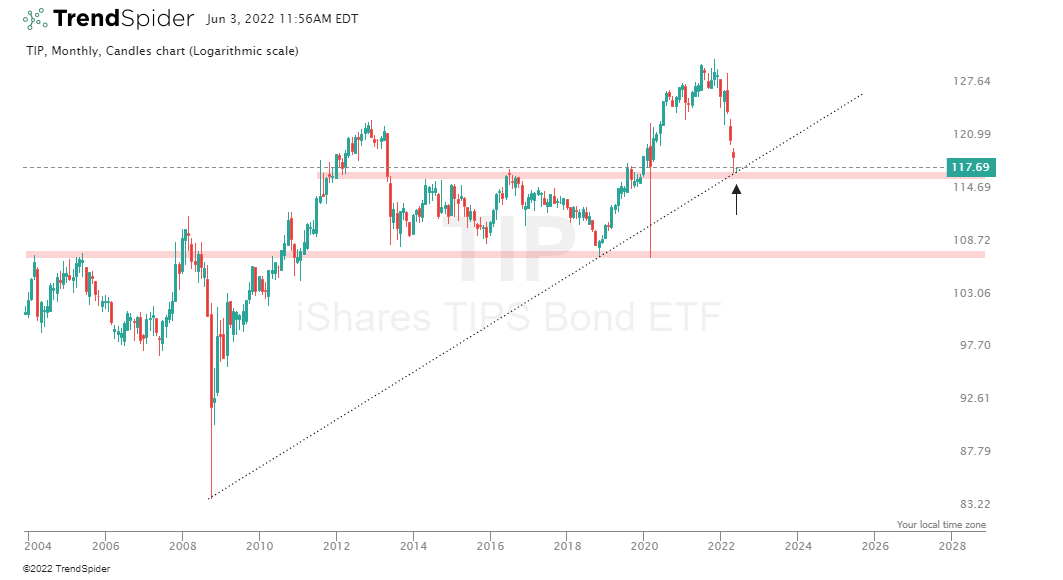
While this is a very complex topic to cover, we will keep things focused by basing ourselves on charts. In this case, the chart in question is $TIP or The iShares TIPS Bond ETF tracking an index of inflation-protected U.S. Treasury bonds. We see in the chart below how June’s monthly candle, currently in the making, will either signal a breakout of a break down for this ETF.
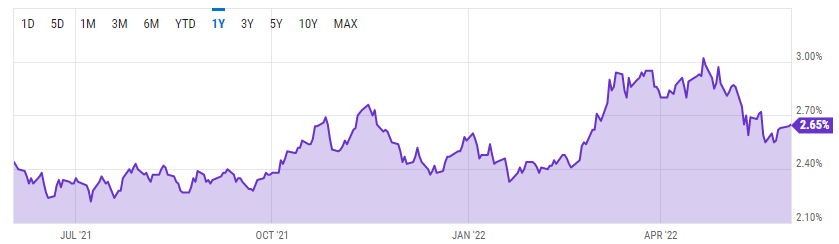
Tip spreads as shown in the chart below, source here, are usually very reliable to predict the future direction of CPI inflation as well. The spread in question is the difference between the U.S. Treasury bonds yields
and (TIPS) the Treasury Inflation-Protected Securities. As these spreads shrink, inflation should stabilize.
They could have peaked at 3% on April the 22nd. Note also how they broke below 2.7% and got rejected from that level.
Recently, we shared also how there is an anomaly in the price of commodities and the US dollar. They both looked as they could be topping and abnormally moving in the same direction. We are still following up on that, but this anomaly breaks the rules of traditional intermarket dynamics and could indicate a potential deflationary environment. We tend to believe that inflation might stagnate at these levels but it’s worth noting what that anomaly could lead to.
Written by hdcharting, reviewed by Taki Tsaklanos


