One of the first articles of 2017 was about copper, and we explained Why The Copper Price Chart Looks Spectacular.
Right now, one month later, the market shows an even more spectacular copper chart.
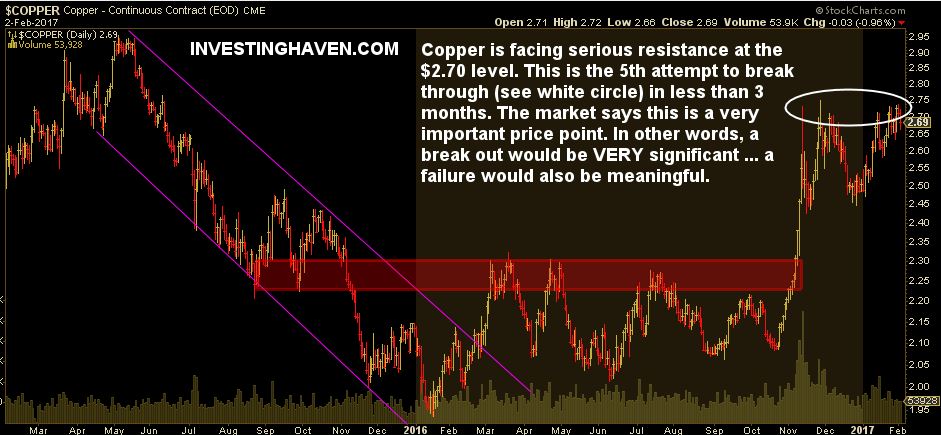
The daily copper chart shown below is back at the magic $2.70 level. for 3 months now, copper is attempting to break out. So far, all 5 attempts have been unsuccessful.
Since October of last year, the price of copper is up exactly 30 percent. That is quite strong, but the point is that copper, once it starts trending, has a tradition to move very sharply in a short period of time, as seen in 2005 / 2009 / 2010 for instance.
On the other hand, once a sideways trading trend takes place, it can also remain in a consolidation phase for a long time.
At this point, the bulls have the benefit of the doubt, as the breakout took place on the weekly copper price chart. However, the daily is important as it shows the shorter term trend, and the market is having difficulties proving the uptrend on the shorter term timeframe.
What happens on the daily chart will be telling. In case copper breaks through $2.70, InvestingHaven’s research team is convinced that the upside potential is significant. However, if $2.70 proves to be too strong of a resistance level, than a retest of support at $2.30 will be the next thing to watch.
The copper market has a lot of tension, and investors are watching this market very closely. The $2.70 has a very high level of importance.