Investing
Haven
No Result
View All Result
Forecasting Global Markets
  • Login
  • 2023 Forecasts
  • Stocks
  • Commodities
  • Silver
  • Lithium
  • Crypto
  • Top AI Stocks →
  • Top Silver Stocks →
  • TOP ENERGY STOCKS →
  • Top Lithium Stocks →
  • CRYPTO SELECTION →
Investing
Haven
  • 2023 Forecasts
  • Stocks
  • Commodities
  • Silver
  • Lithium
  • Crypto
No Result
View All Result
InvestingHaven
No Result
View All Result

A Crash on Bitcoin’s Chart. Reason To Be Concerned?

by Taki Tsaklanos
July 31, 2018
in Breakout / Breakdown, Crypto & Blockchain
0
Tags: BTC
Bitcoin
Share on FacebookShare on Twitter

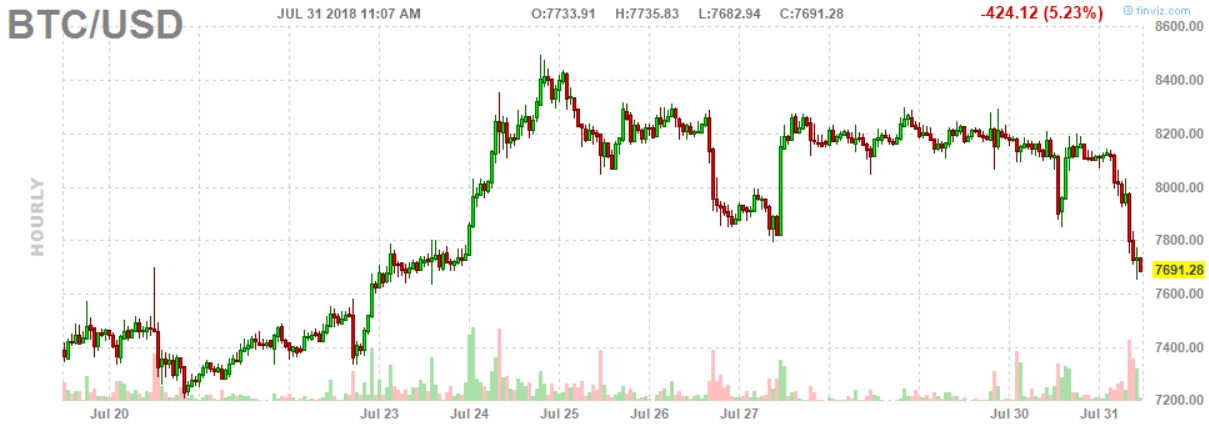
Bitcoin’s price is falling sharply. It lost 5 pct today, and retraced almost 8 pct against its July 24th intermediate top. Bitcoin’s chart (first chart below) looks scary. We start getting messages from readers with a request to write about Bitcoin’s crash. As we see a crash on Bitcoin’s chart we try to understand whether there is (sufficient) reason to be concerned at this point in time.

We would definitely agree with readers if they start getting concerned, at least if it would be based on the form and structure of the first chart embedded below.

Note, before proceeding, that this 5 pct crash is nothing compared to the one week 40 pct price drop in December last year. We wrote, back then, that Bitcoin Typically Crashes Mid-January, and there was indeed another crash in January.

Also, we do not recommend to read the news as that is confusing at best. Take for instance this article on a large Bitcoin site which is just aimed to scare people off. Even on large mainstream media sites like Fortune.com there are rather useless Bitcoin crash articles which are not adding sufficient value to be worth spending an investor’s time.

Bitcoin’s chart shows a crash this week?

Back to this week’s price drop in Bitcoin, there are 2 important things to point out.

First, on the first chart outlined below, there is no breakdown visible. A breakdown is a chart technical term which indicates that a rising pattern is invalidated in which case a bearish trend starts. The first chart would really be scary if Bitcoin’s price was falling below $7400 as that would have been a breakdown. It is not happening, at least not yet.

Second, and way more important, the timeframe of the chart. The first chart below is Bitcoin’s hourly chart. Readers are so focused on the very short term that they forget the big picture which is way more important than the short term.

Crypto is, by far, the most volatile asset out there. It is way too risky to focus on the short term charts. The big picture trend(s) must be respected. That’s why the daily chart, in log scale, is the one of primary focus, combined with the weekly chart.

Bitcoin’s daily chart is outlined below, see the second chart.

bitcoin hourly chart

This daily chart looks much more constructive than the hourly, and that is the whole point we are trying to make.

The point is this: there is no crash whatsoever if you zoom out, on the contrary, there is a constructive pattern.

Look how the $6k level in Bitcoin has been holding up very well, with a V-shaped recovery first, followed by longer rounding bottoms, a very constructive pattern.

So to answer the question: are we concerned? No, we are not, until Bitcoin dips below $6k there is no reason whatsoever to be concerned. This is a normal recovery process.

This analysis, about much more cryptocurrencies and blockchain stocks, in great detail, very actionable, is what premium subscribers of InvestingHaven’s blockchain & crypto investing service receive. Become a member now >>
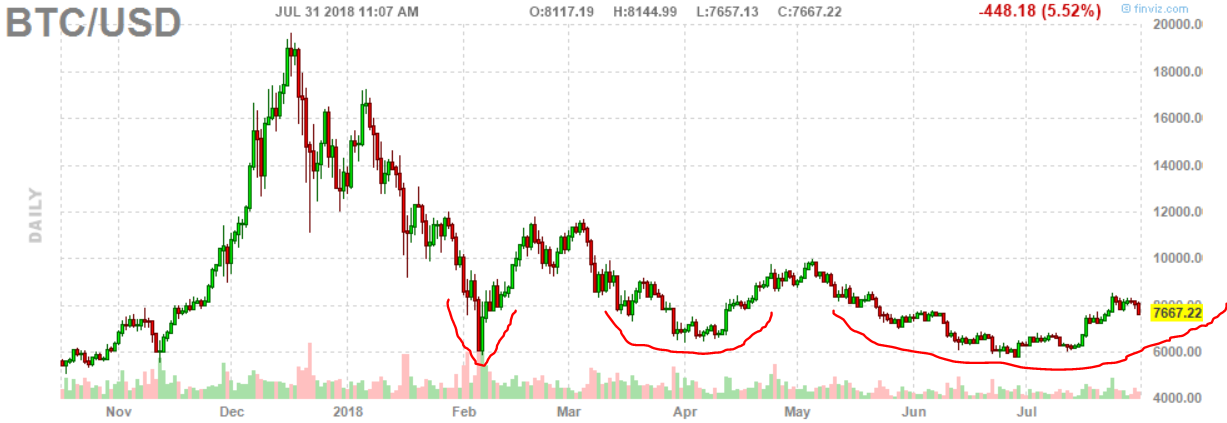
bitcoin daily chart

Receive our weekly newsletter.

*We hate spam as you do.

premium service trade alerts   premium service trade alerts   premium service crypto teaser  
WARNING: InvestingHaven.com, our site, is not affiliated and has no connection whatsoever with Invest Haven Group on Invest-Haven.com or Investing-Haven.com. InvestingHaven.com did not have and will never have sales reps. Do not accept financial offers, certainly not by telephone, this is why >>
Taki Tsaklanos

Taki Tsaklanos

Taki has +15 years of experience in global markets. His methodology is unique and effective, yet easy to understand; it is based on chart analysis combined with intermarket / fundamental / sentiment analysis. His work appeared on major financial outlets like FinancialSense, MarketWatch, ... Email: taki.tsaklanos@gmail.com. Twitter: twitter.com/investinghaven

Latest

stocks forecast

How To Know When The S&P 500 Confirms A Bullish Turning Point?

September 28, 2023
cryptocurrency forecast prediction

The Most Bullish Cryptocurrency Chart Setup Of October 2023

September 28, 2023
leading indicators

Will The S&P 500 Find Support At Its 200 Day Moving Average?

September 24, 2023
uranium stocks

Is The Breakout In The Uranium Market Confirmed?

September 24, 2023

Connect with InvestingHaven

Receive top notch forecasts for free.

*We hate spam as you do.

Categories

  • 2023 Forecasts
  • Stocks
  • Commodities
  • Silver
  • Lithium
  • Crypto

Site Navigation

  • RSS Feed
  • About us
  • Mission 2026
  • Sitemap
  • Privacy & Disclaimer
  • Terms of Service
  • InvestingHaven vs. Invest-Haven
  • Contact Us
Investing
Haven

Top notch forecasting with gold price forecast, many stock predictions, cryptocurrency charts. Many investing tips and crypto market analysis.

Copyright © 2023 InvestingHaven

No Result
View All Result
  • 2023 Forecasts
  • Stock market
  • AI Stocks
  • Alternative Energy
  • Lithium Articles
  • Lithium Stocks
  • Silver Articles
  • Silver Stocks
  • Crypto Articles
  • Premium Crypto Research
  • Premium Services & MyAccount

Copyright © 2023 InvestingHaven

Login to your account below

Forgotten Password?

Fill the forms bellow to register

All fields are required. Log In

Retrieve your password

Please enter your username or email address to reset your password.

Log In

    InvestingHaven.com honours your privacy. Read our Privacy Policy