
Early January we published the first investment roadmap 2018 with 12 stocks which we considered worth buying. In this second part we will review our investment performance for the last quarter, make an assessment of current market situation and make a few changes in current portfolio.
For those who did not buy the previous report we provide access to the report in pdf format by clicking this hyperlink: InvestingHaven’s_Top_12_Stocks_for Q1 2018
Before we proceed, let us recap our initial investment constraint based on investors’ requests in point form.
- $12,000 as initial capital;
- no short-selling of stock is allowed, not even by using options;
- we are not concerned about a gap up or gap down of stock prices due to earnings or unexpected news;
- commission of trades will be excluded and dividend received will not be computed;
- sudden market changes will not affect our holdings;
- entry of newly selected stock will be on the opening price on the first day of new quarter;
- there will not be any trades in between.
I like to take this opportunity to thank all our readers/investors who have faith and trust in us even during extremely volatile months of Feb and Mar. The correction came so abruptly that it caught many by surprise. We can sense their real concern as there was panic sentiment out there based on the emails we received from readers.
However, a couple of weeks ago, we made this assessment of the SPX and Dow Jones industrial. We published the fact that we are not concerned for the rest of the year. As our investment strategy is considered conservative, we seek to minimize the impact while making consistent gain.
We honoured our words and action with the P&L statement below where readers/investors who paid for first premium can verify it. Individual gains and losses can be seen clearly and we also benchmark our investment performance to the 4 major indices. For the 1st quarter of 2018, our investment made a modest gain of 8.6%. Though we beat the indices but we are not going to be complacent as we have still 3 more quarters to go.
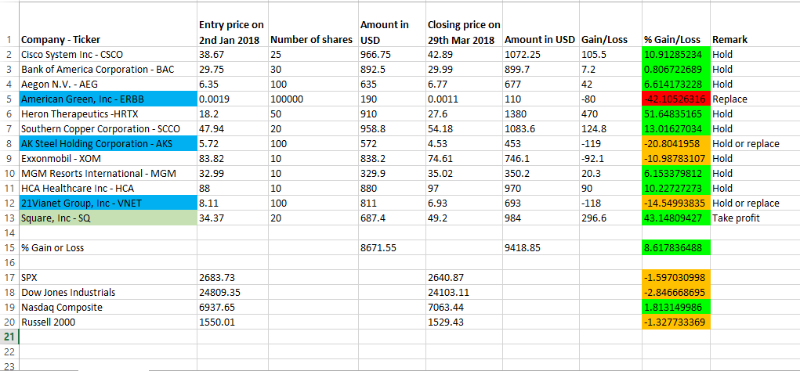
P&L demo statement for 1st quarter 2018
We decided to take profit for Square, Inc (SQ), replaced 21Vianet Group, Inc (VNET), American Green, Inc (ERBB) and AK Steel Holding Corporation (AKS) with Uranium Energy Corp – UEC, American Outdoor Brand Corp – AOBC, and an ETF, Vaneck Vectors India Small cap – SCIF.
It is going to be more uncertain and volatile in Q2. And we do not know whether we will perform better or lower than the current benchmark. The table below shows our reshuffled portfolio and we shall see you again in July where we will compare 1st quarter and 2nd quarter results as well as 1st half year results.
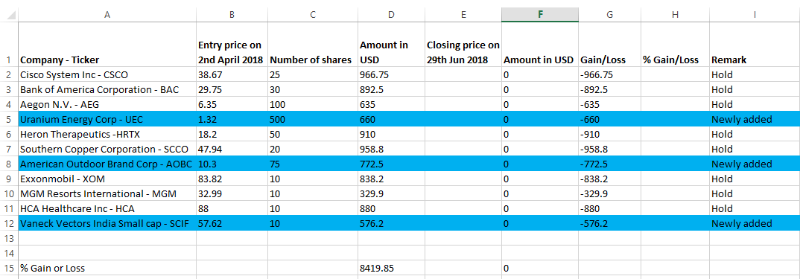
Summary of changes (replacements, profit taking, new additions) compared to the portfolio we set up at the start of Q1:
- American green ERBB >> replaced
- 21Vianet group VNET >> replaced
- AKS Steel holdings AKS >> replaced
- SQ >> Took profit
- American Outdoor Brand Corporation (AOBC) >> new addition
- Uranium Energy Corp (UEC) >> new addition
- Market Vectors India Small Cap Index ETF (SCIF) >> new addition
New Additions: 3 high profit stocks
American Outdoor Brands Corporation (NASDAQ: AOBC) formerly Smith & Wesson Holding Corporation, represents a broad and growing array of brands and companies in the shooting, hunting, and outdoor enthusiast markets.
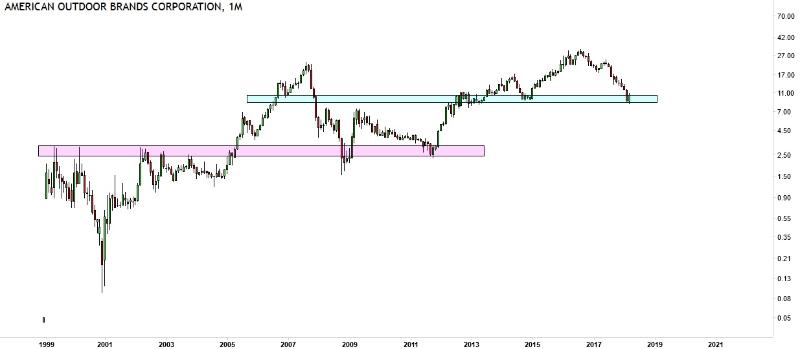
Monthly chart of AOBC
Price of AOBC has huge resistance at ~2.7 for good six years before a convincing break above hitting as high as 21.5 in 2008 global financial crisis and revisited 2.7 zone twice. Price had another sharp fall starting July 2016 and seems to have found support ~9.50. There is a potential of price revisiting ~17 or more, hence this is one of our choice to include this stock.
Uranium Energy Corporation (NYSE: UEC) is a U.S. based uranium mining and exploration company. Operations are managed by professionals with a recognized profile for excellence in their industry, a profile based on many decades of hands-on experience in the key facets of uranium exploration, development and mining. The Company controls one of the largest databases of historic uranium exploration and development in the country. Using this knowledge base, the Company has acquired and is advancing exploration properties of merit throughout the southwestern U.S. It is fully licensed and permitted Hobson processing facility is central to all of its projects in South Texas, including the Palangana in-situ recovery mine and the Goliad in-situ recovery project which is fully permitted for production and under construction. The Company is well financed to aggressively pursue its key development targets. Uranium Energy Corp is well positioned to capitalize on the world’s overwhelming demand for more uranium, for more energy, for cheaper energy and for a cleaner environment.
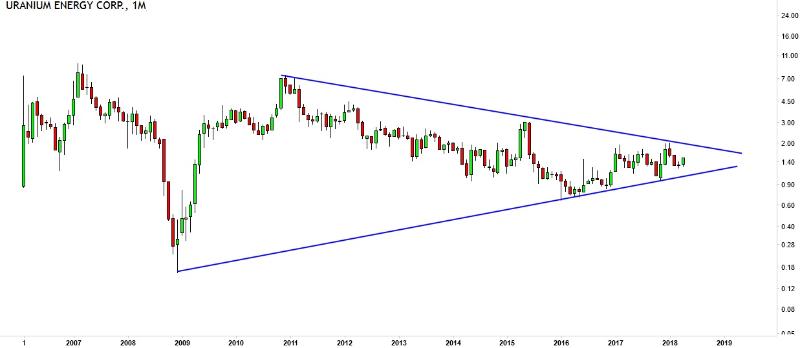
Monthly chart of UEC
Since the inception of trading, price of UEC has been trapped within 0.2 to 9.2. That happened in the peak of Feb 2017. After hitting a low of 0.2 which is equivalent to a penny stock, it made its way back to 7. From then on, it fluctuates in a smaller range to what appears to be a converging triangle. At the time of writing price is traded at 1.48. Because of the demand for cleaner and sustainable energy, Uranium is one of the excellent choice. We foresee price moving to 1.90 for next quarter and if it breaks above, a target of 3 dollar is possible. On the other hand, if price breaks below 1.1 by end of June, we will mostly likely replace it again.
Market Vectors India Small Cap Index ETF (NYSE: SCIF). We decided to make a brave move by venture into an ETF from emerging market – India. VanEck Vectors® India Small-Cap Index ETF (SCIF®) seeks to replicate as closely as possible, before fees and expenses, the price and yield performance of the MVIS® India Small-Cap Index (MVSCIFTR), which is comprised of securities of small-capitalization companies that are incorporated in India or that are incorporated outside of India but have at least 50% of their revenues/related assets in India. The components are made up of discretionary goods and services, homebuilding, and infrastructure which is a boom to India’s middle class and is expected to fuel demand for future growth.
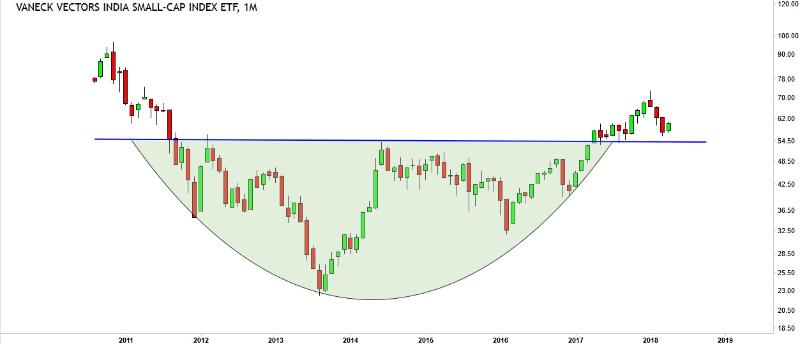
Monthly chart of SCIF
If our interpretation is correct, the monthly chart shows a completed rounding bottom for this etf. And that also apparently has an inverted head and shoulder embedded. This is technically bullish for future. Price has broken above the neckline, and retraced and seems to found support. We expect price to re-challenge 72.5 if foreign investors are still flowing into India – emerging market. By end of Jun 2018, if price breaks below 54, the outlook will be more into choppy trading range.


