Investing Haven
No Result
View All Result
Gold Silver Investing >>
CRYPTO INVESTING >>
  • 2025 Forecasts
    • 10 market predictions
    • Dow Jones forecast
    • S&P 500 forecast 2025
    • Nasdaq prediction 2025
    • Best altcoins to buy
    • Best crypto to buy now
    • Which crypto will explode
    • 15 crypto forecasts 2025
    • Which precious metal to buy
  • Silver
    • Silver prediction 2025 – 2030
    • Will silver exceed $30?
    • When will silver hit $50?
    • Can silver hit $100?
    • Silver shortage
    • 50-year silver chart
    • Silver bullish reversal
    • Silver seasonality charts
    • How to invest in silver
  • Gold
    • Gold prediction 2025 – 2030
    • Will gold set new ATH?
    • Will gold hit $3,000?
    • Can gold hit $10,000?
    • Gold chart 10 years
    • Gold chart 50 years
    • Gold chart 100 years
    • Gold silver ratio
    • Gold seasonality charts
  • Commodities
    • Coffee forecasts
    • Sugar forecasts
    • Nickel forecasts
    • Lithium investing
  • Crypto forecasts
    • BTC prediction 2025 – 2030
    • ETH prediction 2025 – 2030
    • SOL prediction 2025 – 2030
    • XRP prediction 2025 – 2030
    • XLM prediction 2025 – 2030
    • BNB prediction 2025 – 2030
    • ADA prediction 2025 – 2030
    • AVAX prediction 2025 – 2030
    • KAS prediction 2025 – 2030
    • NEAR prediction 2025 – 2030
    • BCH prediction 2025 – 2030
    • LINK prediction 2025 – 2030
    • DOT prediction 2025 – 2030
    • SUI prediction 2025 – 2030
    • ICP prediction 2025 – 2030
    • LTC prediction 2025 – 2026
    • STX prediction 2025 – 2030
    • DOGE prediction 2025 – 2030
    • SHIB prediction 2025 – 2030
    • PEPE prediction 2025 – 2030
    • FLOKI prediction 2025 – 2030
    • WIF prediction 2025 – 2030
    • ONDO prediction 2025 – 2030
  • News
    • Crypto news
    • Commodities
  • Login
Investing Haven
No Result
View All Result

Home » Breakout / Breakdown » SPX and DJIA Approaching Crucial Support Levels

SPX and DJIA Approaching Crucial Support Levels

Ralf Lai by Ralf Lai
September 8, 2019
in Breakout / Breakdown
supp
2.3k
VIEWS
Share on FacebookShare on Twitter

The S&P 500 (SPY), the Dow Jones Industrial Index (DJI) and most indices closed in the red on Friday. Since February 1st, markets experienced a rather volatile period and it was no exception for both the S&P 500 (SPX) and the Dow Jones Industrial Average (DJIA). Our article today will look into why Both the S&P 500 and the Dow Jones Industrial Average are down and most important, what are the crucial support levels investors should watch for.

SPX and DJIA Down, what triggered the drop?

Stocks had a strong start in 2018, and just as investors were getting more and more complacent, a first market correction hit in a quick and unexpected way. In retrospect, complacency describes best the sentiment in the market towards the end of 2017 and the start of 2018. Back then, when we wrote about the potential correction in the stock market and warned specifically about the general complacency we noticed, it seemed like it was impossible for the rally in the American markets to stop let alone a correction to happen. 2 months ago, we also noticed how the Home Construction industry was correcting: Watch Out Below. Is The Home Construction Sector Eyeing This Support Level?

Yet the market correction happened, not in November as we initially forecasted but in February 2018. As markets started recovering, the market took, again, another abrupt turn. Financial news were quick to point out the rising yield as the main factor that spooked investors.  Later on, they pointed towards the announcement of  “Trump tariffs” on imported steel and aluminium. A few days ago, the fear in the market was driven by concerns over a potential trade war with China whom vowed to slap the equivalent tariff on US exports.

SPX and DJIA: The real story is in the charts

If our warning of a potential quick crash in SPX in 2018 went unnoticed, for the past two weeks, we have been receiving countless emails and requests to assess the impact of the recent markets movements in the stock market and indices as a whole. This article today seeks to educate investors on important price levels to watch for if indices continue to head south.

In fact, during this extended period of high volatility where indices have been fluctuating with more than 500 points due to phony financial news and unnecessary panics, our InvestingHaven research Team firmly believes that the most valuable information can be retrieved from charts rather than news.

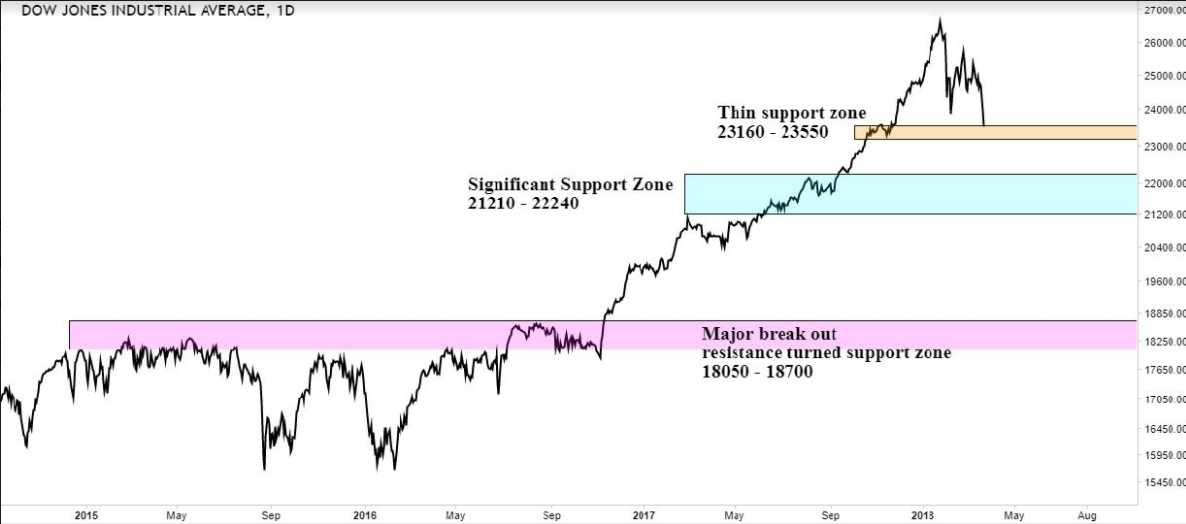
The daily Dow Jones Industrial Average (DJIA) line chart shows that the DJIA index is going towards the thin support zone of 23160 – 23550 for sure within the next 2 weeks. We feel that this thin zone has a large chance of being pierced through a’though the latest news has top officials from USA and China agreeing to communicate on trade issue.

Our research team is more concerned with the significant support zone of 21210 – 22240 (±). Should the blue zone break lower, the penultimate zone lies in the 18050 – 18700 as this is also the former resistance turned support. It is also a major pre-Trump support zone. Still, no matter how much we emphasize the strength of this support zone, the price could decide otherwise without heading towards the zone we identified.

Similarly, the same behavior can be observed in the SPX. The thin zone of 2560 – 2590 looks vulnerable for the next 2 weeks. 2380 – 2480 will be the critical support zone and this support is breached, the next most important support zone will be 2130 – 2185.


Through volatility, the most important action is to remain calm to be able to make sound decisions. This will be particularly hard for those who bought at the Top. Please do discuss with your financial adviser and brokers for more money management and risk mitigation during time of high volatility.


10-YEAR ANNIVERSARY OFFER: InvestingHaven.com celebrates 10 years. Temporarily, you can enjoy a discount on our premium gold/silver and crypto reports. Or you can become a VIP member. Go to our anniversary deals >>
Receive our weekly newsletter.

premium service SP-500 premium service trade alerts premium service crypto teaser 

No related posts.

Tags: Dow Jones chartsSPX
Ralf Lai

Ralf Lai

Ralf Lai has a scientific background. He learnt investing the hard way. He invested his hard-earned savings in stocks back in 2011, at the highs, partly due to his ignorant beliefs in financial news.He decided to stop following mainstream financial news, and start reading every technical analysis book available. In doing his analysis he discovered a passion in researching the WHY question behind movements. Combined with the fact that he is a very curious person, and an insatiable appetite to learn, he started learning the ability to decipher charts.He has developed into a TOP-DOWN approach, meaning monthly historical data and daily or 4 hour entry using candle as an entry signal, indicator. With his sharp analysis he joined the InvestingHaven team in October 2017.

Leave a Reply Cancel reply

Your email address will not be published. Required fields are marked *

Connect with InvestingHaven

Receive top notch forecasts for free.

*We hate spam as you do.

Site Navigation

  • RSS Feed
  • About us
  • Advertising
  • Sponsored Content Policy
  • Mission 2026
  • Sitemap
  • Privacy & Disclaimer
  • Terms of Service
  • Contact Us
investing haven logo

Precious metals market analysis including gold and silver price predictions. Crypto market analysis including highly accurate BTC ETH SOL XRP forecasts.

Copyright © 2025 InvestingHaven

Login to your account below

Forgotten Password?

Fill the forms bellow to register

All fields are required. Log In

Retrieve your password

Please enter your username or email address to reset your password.

Log In

Receive top notch forecasts for free.

*We hate spam as you do.

No Result
View All Result
  • News
  • 2025 Forecasts
    • 10 market predictions
    • Dow Jones forecast 2025
    • S&P 500 forecast 2025
    • Nasdaq prediction 2025
    • Best crypto to buy now
    • Which crypto will explode
    • Best altcoins to buy
    • 15 crypto forecasts 2025
    • Which precious metal to buy
  • Silver articles
    • Silver prediction 2025 – 2030
    • Will silver exceed $30?
    • When will silver hit $50?
    • Can silver hit $100?
    • Silver shortage
    • 50-year silver chart
    • Silver bullish reversal
    • Silver seasonality charts
    • How to invest in silver
  • Gold
    • Gold prediction 2025 – 2030
    • Will gold set new ATH?
    • Will gold hit $3,000?
    • Can gold hit $10,000?
    • Gold chart 10 years
    • Gold chart 50 years
    • Gold chart 100 years
    • Gold silver ratio
    • Gold seasonality charts
  • Commodities
    • Sugar forecasts
    • Coffee forecasts
    • Nickel forecasts
    • Lithium investing
  • Crypto news
  • Crypto forecasts
    • BTC prediction 2025 – 2030
    • ETH prediction 2025 – 2030
    • SOL prediction 2025 – 2030
    • XRP prediction 2025 – 2030
    • XLM prediction 2025 – 2030
    • BNB prediction 2025 – 2030
    • ADA prediction 2025 – 2030
    • AVAX prediction 2025 – 2030
    • KAS prediction 2025 – 2030
    • NEAR prediction 2025 – 2030
    • BCH prediction 2025 – 2030
    • LINK prediction 2025 – 2030
    • DOT prediction 2025 – 2030
    • SUI prediction 2025 – 2030
    • ICP prediction 2025 – 2030
    • LTC prediction 2025 – 2026
    • STX prediction 2025 – 2030
    • DOGE prediction 2025 – 2030
    • SHIB prediction 2025 – 2030
    • PEPE prediction 2025 – 2030
    • FLOKI prediction 2025 – 2030
    • WIF prediction 2025 – 2030
    • ONDO prediction 2025 – 2030
  • Premium Crypto Alerts
  • Premium services

Copyright © 2025 InvestingHaven