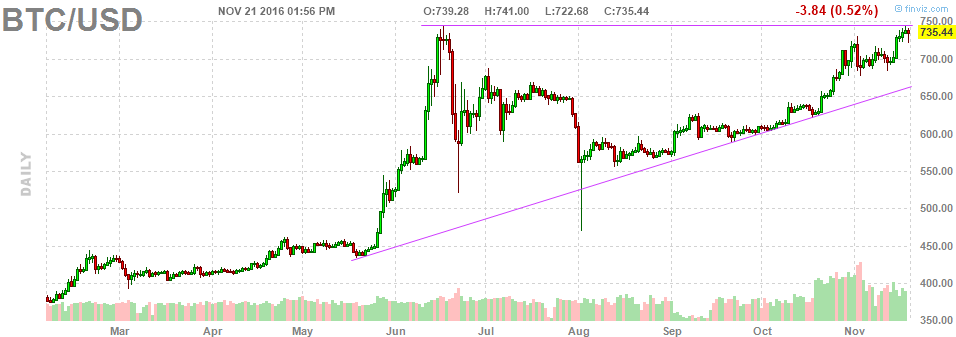
The Bitcoin price is very close to breaking out to multi-year highs. In June of this year, the cryptocurrency rose very sharply from 450 USD to 740 USD, after which is collapsed to 525 USD. In August, a flash-crash occurred as Bitcoin fell to 460 USD.
Things became very bullish since then, and the Bitcoin price chart looks very constructive at this point. Bitcoin is trading at 735 USD at the moment of writing, which is just one percent below multi-year highs.
The first chart is the daily chart on 9 months.
The second graph shows the weekly chart, on a longer term timeframe. The only moment in time that Bitcoin traded higher than 750 USD is in 2014, right before it collapsed.
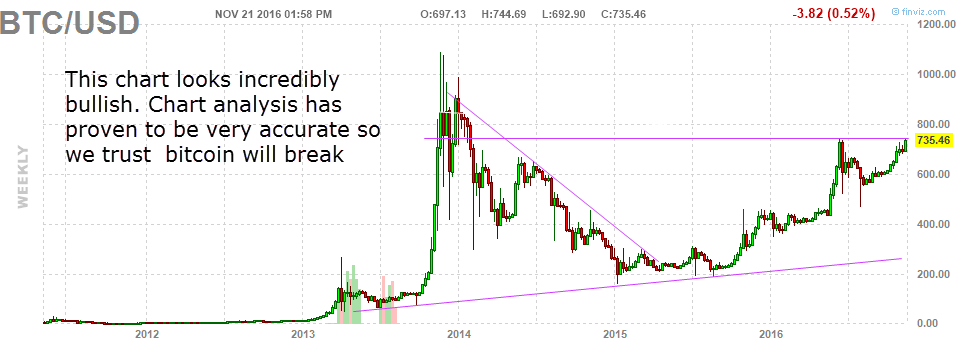
Our chart analysis applies quite accurately to Bitcoin as seen on above charts.
Moreover, according to our methodology, sentiment plays an important role in analyzing markets. Currently, we don’t see any bullishness, especially in mainstream media, on Bitcoin. That is of course fantastich news for investors. The combination of a very constructive chart setup with neutral sentiment is a fantastic cocktail, a recipe for profits.
We are looking into bitcoin stocks, providing an extremely high leverage and, consequently, extremely risk, for short term momentum.


