
The InvestingHaven team monitors crude oil prices closely especially the weekly and monthly timeframes. Our ‘eagle eyes’ spotted a potentially meaningful pattern which we feel it worth sharing with our readers. It may determine the future price direction of crude oil for 2018 and beyond.
About 3 months ago our crude oil price forecast of hitting 60-62 zone appeared to be spot-on, read our crude oil forecast 2018 (OIL). And the bullishness of crude oil broke this resistance zone, and achieved an intraday high of ~66.5 before starting a retracement. We are not interested in the so-called ‘reasons’ why the price of crude oil fell for last 2 weeks. Instead, we will focus on explaining it from a chart perspective.
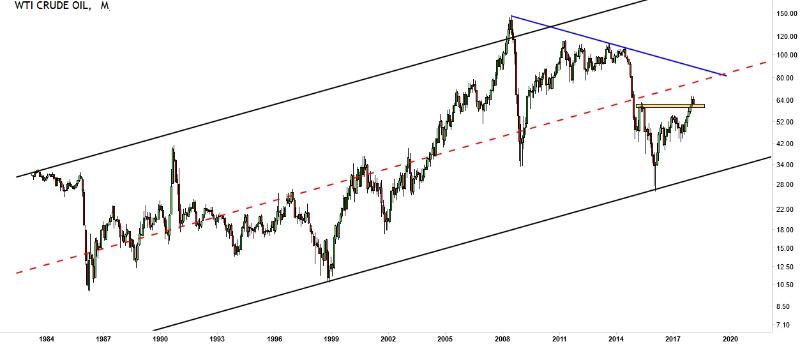
Monthly chart of crude oil
The monthly channel of crude oil remains intact. Price broke the orange zone and currently engages in retracement mode.
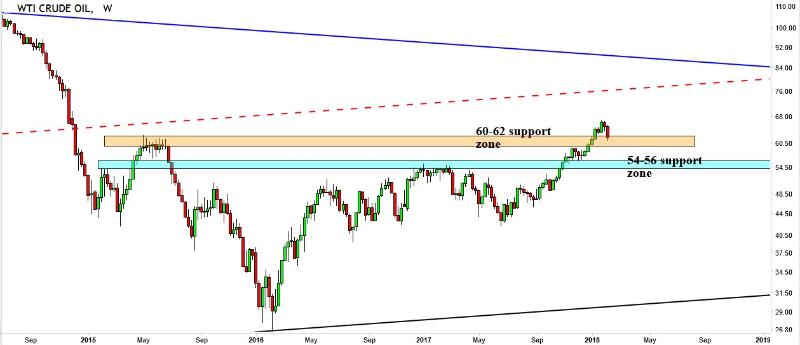
Weekly chart of crude oil
How to get a sense of the crude oil future price forecast
The weekly chart allows us to see more detail on the price movement. We are certain that the crude oil price is in a text book scenario of breaking resistance, overshooting and retracing to test if the resistance turned support is true support for further upside (as visually shown in the next graph).
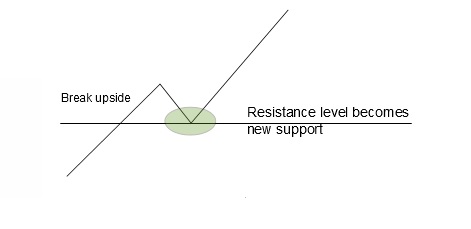
Text-book case of breaking resistance, retest and resume underlying trend.
Does it mean that price will reverse at this level immediately? As of now until the end of the week ending 9th Feb 2018 we do not see this as a plausible possibility unless a buy signal emerges over the next few days. What we want to conclude is that the crude oil price is definitely testing this immediate support zone of 60-62, until a clear buy signal happens, no further comment can be made.
Crude oil near term forecast
However, we do see 2 scenarios of what could be happening in the near future.
- Somehow price manages to find support at this level, reverses, breaks 66.5 and go higher with projection of 82-84,
- Price breaks below 60-62 and goes on to test 54-56 which is another crucial support zone. If crude oil price really goes 54-56, we will surely update our readers.
There is another meaningful observation that we want to bring up, particularly the comparison of the weekly chart of crude oil with the Dow Jones Industrial Index shown below. Most often than not since May 2015, whenever there is a major turn in crude oil price, it more or less affects the index. When crude oil goes up the index definitely moves in tandem and vice versa. As of latest, we see the huge drop in index really says a lot about the crude oil’s reversal.
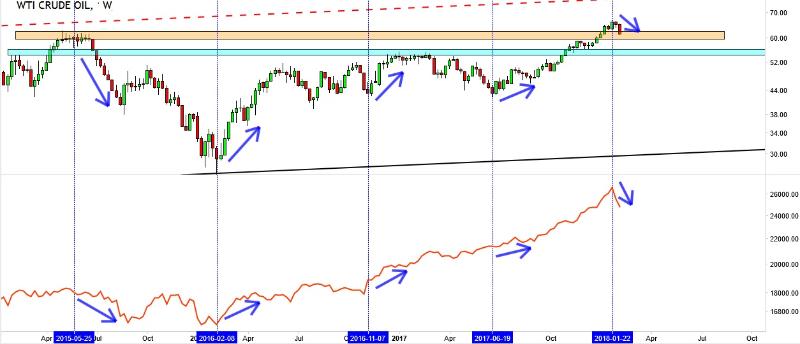
In conclusion, we highly suspect that the index will reverse and resume its upward trend only when crude oil stabilises and move beyond the recent top price of 66.5. Stay tuned.


