![[:en]emerging stock markets[:nl]groeimarkten[:]](https://investinghaven.com/wp-content/uploads/2017/05/emerging_stock_markets-1024x682.jpg)
One of the major themes at InvestingHaven is the bullish era of emerging markets. We tend to closely follow these bullish trends as they develop because a bull market does not start at a ‘point’ in time, it is rather a process which unfolds over time. It also tends to fool investors with false breakouts or false breakdowns. Emerging markets ‘tested’ secular support in June, and, provided support holds strong, it might the final confirmation of the new grand bull market of emerging markets that we started writing about 2 years ago! Are emerging markets still bullish in 2018?
Get the ultimate Guide for scalping with forex on the website of All Top Start Ups.
Early 2018 we noticed that emerging markets (EEM) were about to enter a new bull market: It’s Official: Emerging Markets New Major Bull Market In 2018 Is Now Confirmed. The point about this observation was what we tend to call a ‘breakout’ which is nothing else than a market rising over its previous highs. This is, in chart terms, an extremely important event that may have long lasting implications.
Since February, however, Emerging Markets have been Weak flirting with Buy vs Sell signals. This was the key take-away from that deeper-dive chart analysis:
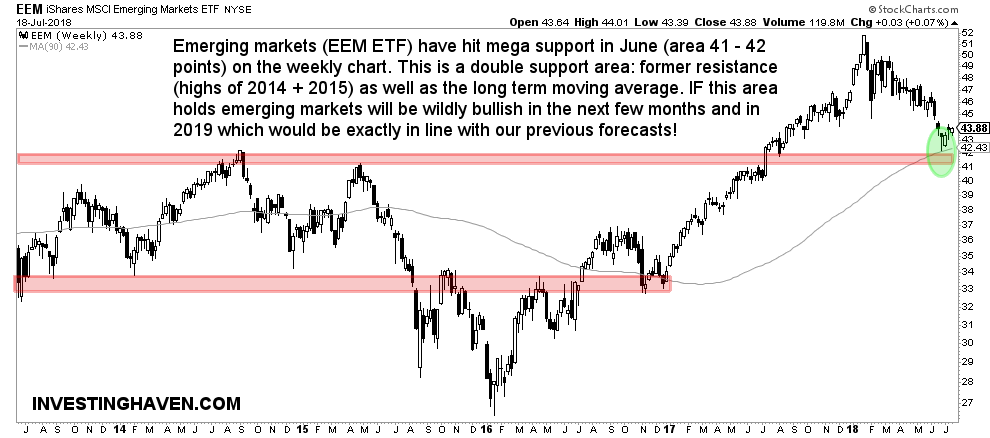
The weekly emerging markets chart on 5 years has some nice insights, first and foremost a longer term support zone in the 41 – 42 points area. However, there is visibly not sufficient info on this chart, so we have to zoom out to the monthly chart.
The monthly term chart shows two major breakout lines: the one at 44.81 points (the 2007 peak) as well as the trendline connecting all major peaks since 2007. The latter comes in at 40 points. We highly suspect that the 40 points area of the emerging markets ETF EEM might be tested in the coming weeks and month(s).
We concluding saying that we feel quite confident “that there is maximum 10 pct downside in emerging markets. It implies that emerging markets might be very close to a very attractive entry point.”
That’s when the emerging markets ETF, our primary indicator, was trading near 44 points.
Since then, it took a hit, fully in line with our forecast, and came down to 42 points, only to recover quickly from there. That was a 5 pct further retracement.
As shown on the weekly chart below 42 points is a make-or-break level for 2 reasons.
As long as emerging markets do not go below 42 points it will be a hugely bullish sign!