Facebook (FB) wiped out $119B in market cap in less than 24 hours. It is the largest market cap loss in one day in history. Facebook’s stock writes history. So where is Facebook’s stock heading now? Is it the start of a crash? Is this a dip before it continues its march higher? InvestingHaven’s research team is on record answering this question with a Facebook stock forecast for 2018.
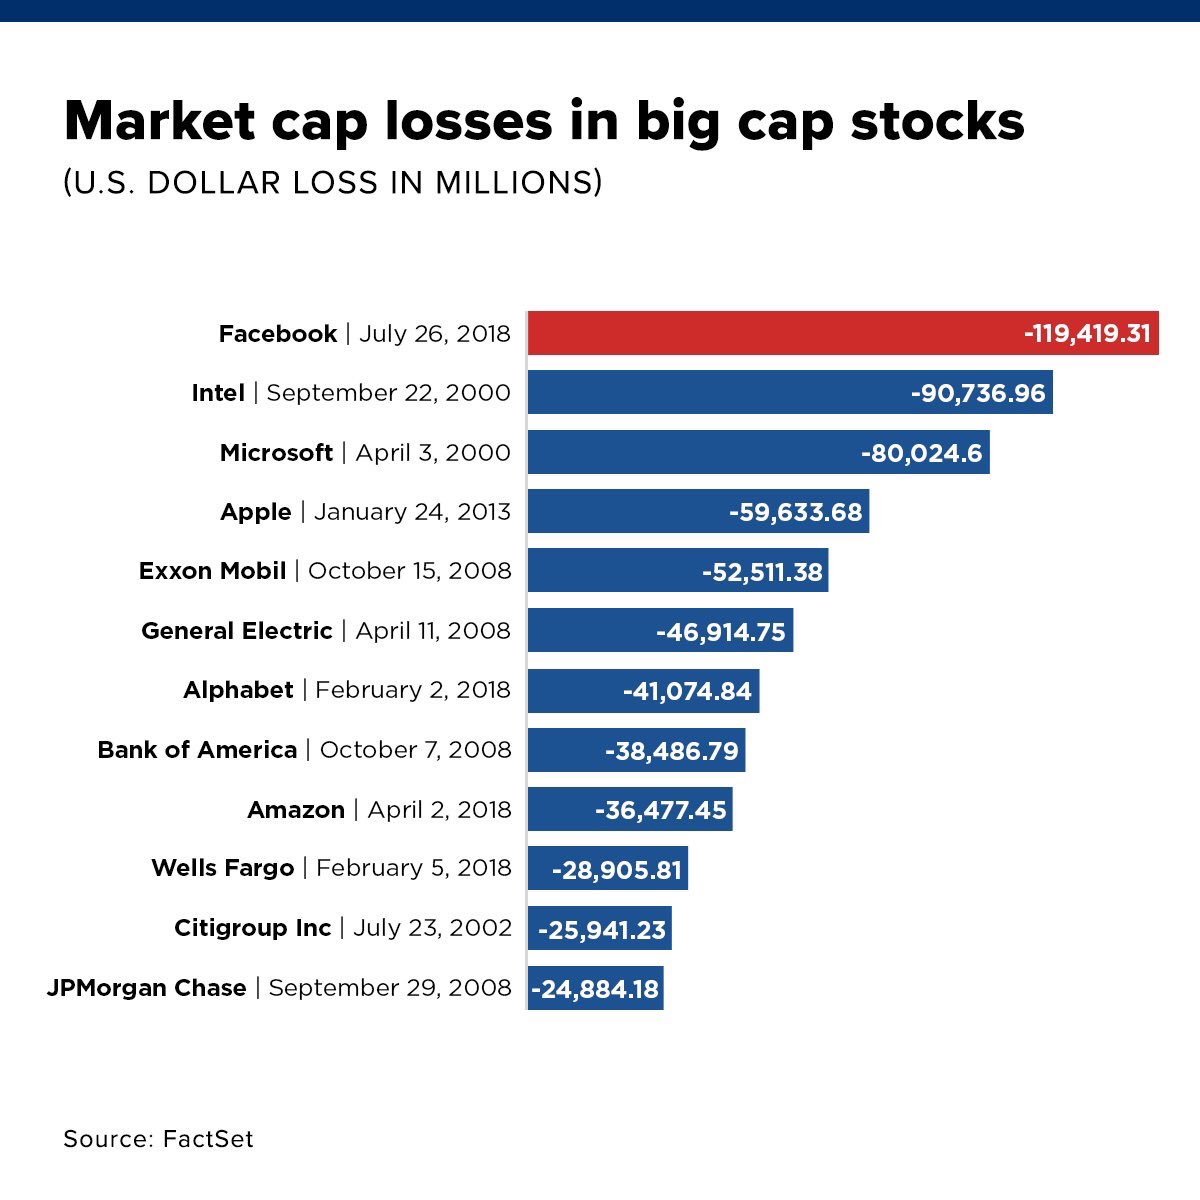
Before looking into our forecast we want to share this overview with you. It shows the largest market cap losses in history in large cap stocks. As seen, Facebook’s loss is 30 pct more than the second one which is the Intel losses during the dot com crash!
Moreover, it appears from this overview that 3 years stand out: 2000, 2008 and also 2018. Interestingly, stock market indexes are trading at all-time highs, at least in the U.S., so it does not feel like 2000 or 2008. Presumably this means that we saw an important top in select large cap stocks in 2018 but a rotation into mid-cap might be taking place now. We certainly would not forecast that a market crash is coming, on the contrary, as explained in The Most Important Chart Of This Decade: Are Yields Signaling A 2008-Alike Scenario !
InvestingHaven’s Facebook stock price forecast
As always, it does not pay off to rely on mainstream media when trying to forecast a stock price like in our case Facebook. It simply does not work, as you get too many opposite viewpoints, which, in essence, is not bad but it has not value. Look at this bullish vs this bearish case.
Also, this series of forecasts on Facebook’s stock says that analysts predict a stock price between 142 and 275 USD which, again, might be interesting at best but has no value whatsoever. This one certainly does not help neither.
The one and only, by far most relevant, way to forecast Facebook’s future stock price is the combination of this monthly, weekly and daily charts, in particular the dominant patterns on those charts.
Per InvestingHaven’s mantra: start with the chart.
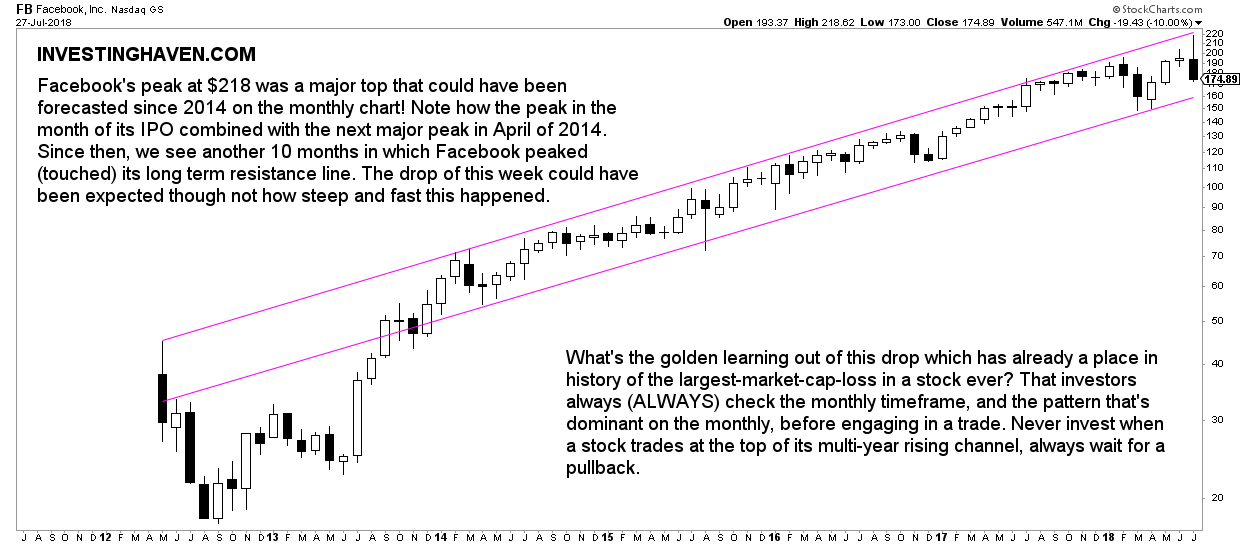
The monthly chart of Facebook would have been an amazing guide for Facebook investors, at least those that used it and got the predictive information out of it that’s available in there.
The monthly chart shows how a strong pattern started to become visible already in 2014. The rising channel which is annotated on the chart simply connects a series of peaks. The parallel support line is perfectly symmetric, which means that the channel has lots of predictive value as it is very reliable.
Would anyone have been able to forecast the steep drop of last week? No, that’s not what we are saying. We are saying that Facebook was trading at the top of its long term channel. There is only one, and only one, pattern visible on this monthly chart, so it must be reliable. The top of the pattern suggested that there was much more downside potential than upside, so a reversal last week was an easy bet.
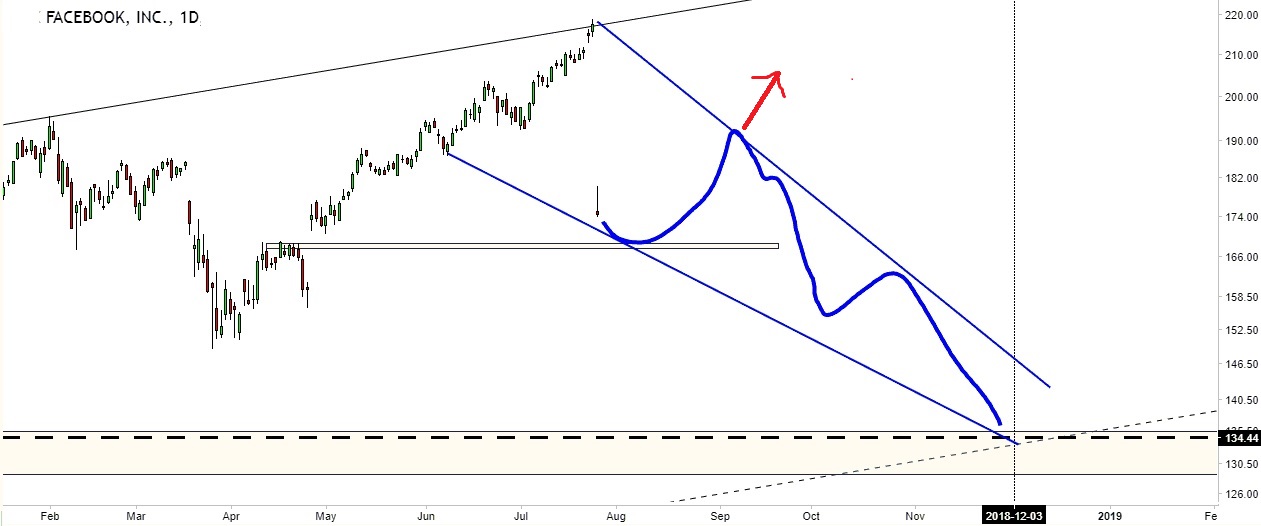
But how low can Facebook fall?
For this to answer we look at the combination of the monthly and daily charts. The monthly suggests there is downside until the support line of the rising channel. To get detailed price info, we have to check the daily where we can see two things. First, there is a first area of support right at $166. However, if $166 does not hold, then our best forecast is that Facebook will fall until the $130 to $140 level. If that were to happen, it would be an amazing buy opportunity.
Our projection is outlined in blue on the chart below.