After today’s Fed’s rate hike, most assets fell, with the exception of the U.S. dollar. Gold, as a consequence, sold off rather sharply. Gold miners almost collapsed as the GDX gold mining index fell more than 5 pct.
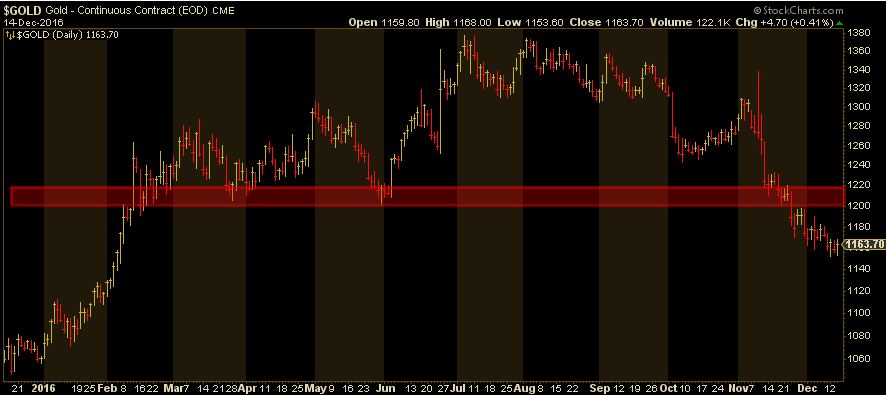
Gold’s daily chart shows how support around the 1200 to 1220 area gave away two weeks ago. We had expected a retest of that area, but after today’s price action it seems unlikely that gold will test that resistance area (former support) anytime soon. Other than that, the daily chart is not really telling, so we have to look at the weekly chart for more insights.
The weekly chart is very clear in that it shows a clear and distinct pattern. After an unsuccessful attempt to break out from the current bear market, in the summer of this year, gold continued its decline. Since October, gold fell again into its former falling trend channel. It seems sufficiently clear that gold is now moving to the lower area of that channel, which is below $1000.
In other words, today’s sell off in gold simply confirms the ongoing down trend in the 5-year bear market.


