Gold bulls had an amazing 2016. The price of gold has rallied sharply, and gold miners have been the real outperformers this year.
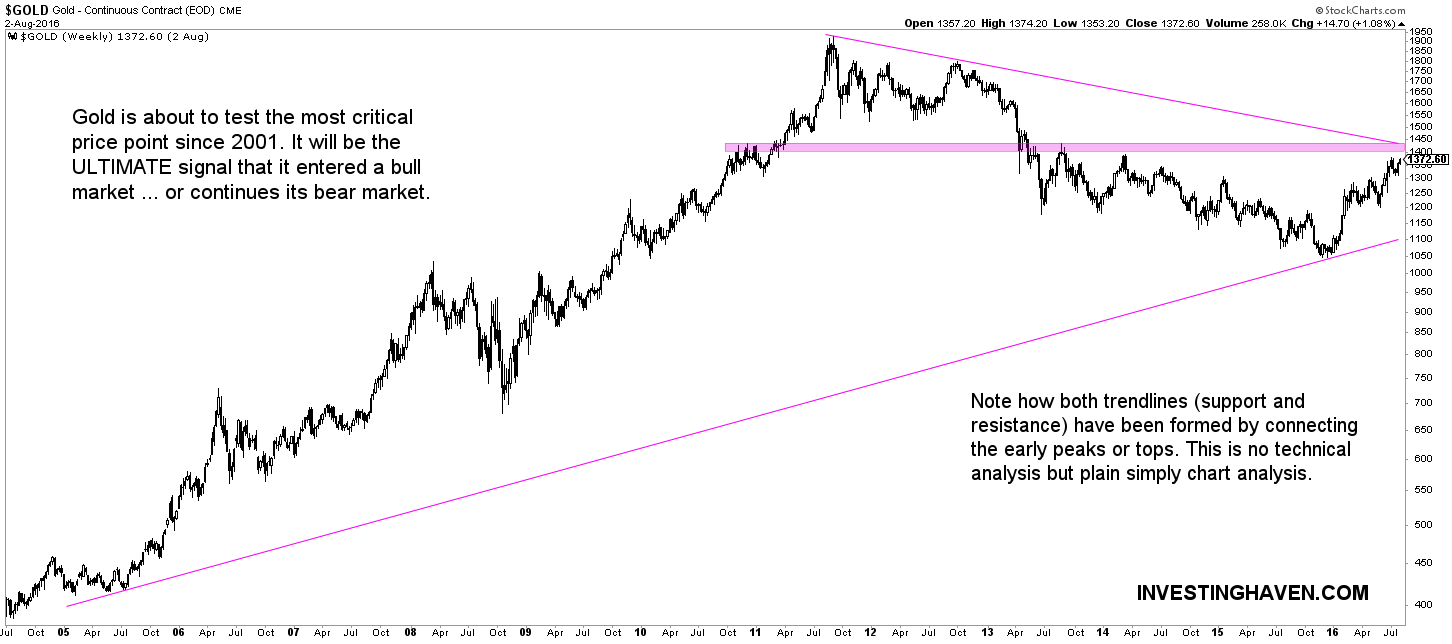
However, gold is now ready to undergo, by far, the most critical test, i.e. the strongest resistance of its bear market.
We are no technical analysts, nor do we engage in complex methodologies. We simply analyze price points which are the basis for chart patterns. One important rule we apply in doing so is that only 5% of price points carry an important value (95% of the value of a chart).
Gold’s historic chart has three distinct phases: a strong uptrend followed by a consolidation and a strong downtrend.
The ultimate test is taking place right now: gold can break out of its downtrend. But will it do so? That is the million dollar question, and it will have huge consequences for metal investors, but also for markets in general.
As the next chart suggests, the $1400 to $1440 area is the most important test of 2016.
We still remain concerned about the huge positions in the COMEX futures market. According to the data on the next chart, gold positions have exploded to all-time extremes, in a very short time period (see center pane). That is not a recipe for continued success, simple as that. So we give the bears the benefit out the doubt, according to our methodology. The coming weeks will be critical; we will remain open and we will conclude whatever the message of the market.
Chart courtesy: GoldChartsRus.com


