We wrote about our conviction that gold would not be able to rise through $1291 /oz, based on the long term trend as well as the medium term chart pattern, combined with the gold COMEX futures market structure.
Meantime, it is clear that our viewpoint was spot on: the price of gold started retracing as it could not hold $1291 /oz for more than a couple of days consecutively.
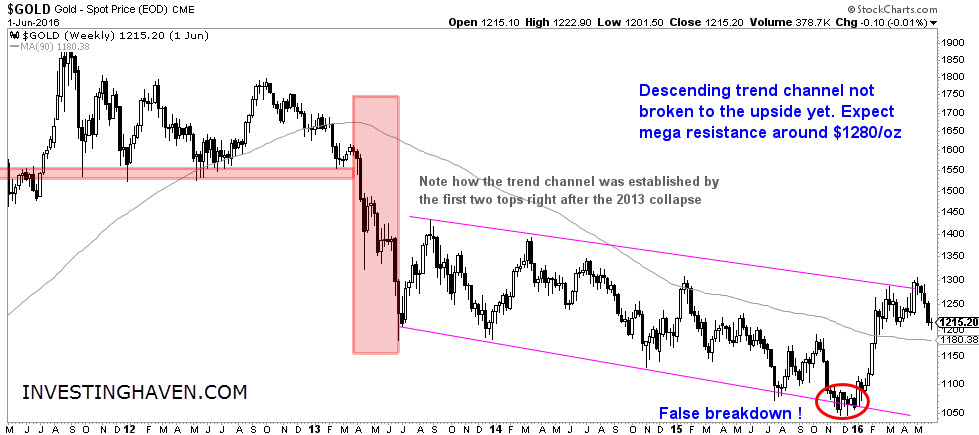
Now what is next? According to gold’s chart pattern, the price of gold will continue its downtrend. A consolidation within the downtrend is definitely a possible scenario, as suggested by a flattening 90 week moving average (see chart below), but, then again, gold remains in a downtrend until proven otherwise.
As said previously, intermarket dynamics do not favor a bull market in gold, as risk indicators are suggesting that a “risk on” sentiment is returning. Moreover, volatility in broad stock markets has come down in recent weeks, and the bond versus stock market ratio is in a trendless state, which does not favor a flight to safety at this point.
At this point, we do not see a good entry point in the gold market. As gold retraces in the days and weeks ahead, we recommend investors to watch how risk indicators, bond markets and the gold COMEX futures market positioning. Based on those indicators, we will get an idea of gold’s outlook for the remainder of 2016.


