The gold (GOLD) price continues to take a hit as the summer doldrums effect kicks in. The summer is typically the low of the years for precious metals, at least that’s what seasonality shows. Will this year be any different? Is gold setting up for a major buy opportunity? Let’s revise the gold price seasonality, and try to understand what may happen with the gold price in July 2018. That would enable us to understand whether our Gold Price Forecast For 2018 is on track or not.
As per Zeal, a gold investing research hub, the summer doldrums are an important phenomenon in the gold market:
Gold has typically suffered a seasonal lull this time of year, on waning investment demand as vacations divert attention from markets. But these summer doldrums offer the best seasonal buying opportunities of the year.
Thus after decades of trading gold, silver, and their miners’ stocks, I’ve come to call this time of year the summer doldrums. June and July in particular are usually desolate sentiment wastelands for precious metals, totally devoid of recurring seasonal demand surges. Unlike the rest of the year, these summer months simply lack any major income-cycle or cultural drivers of outsized gold investment demand.
Gold price seasonality per gold’s price chart
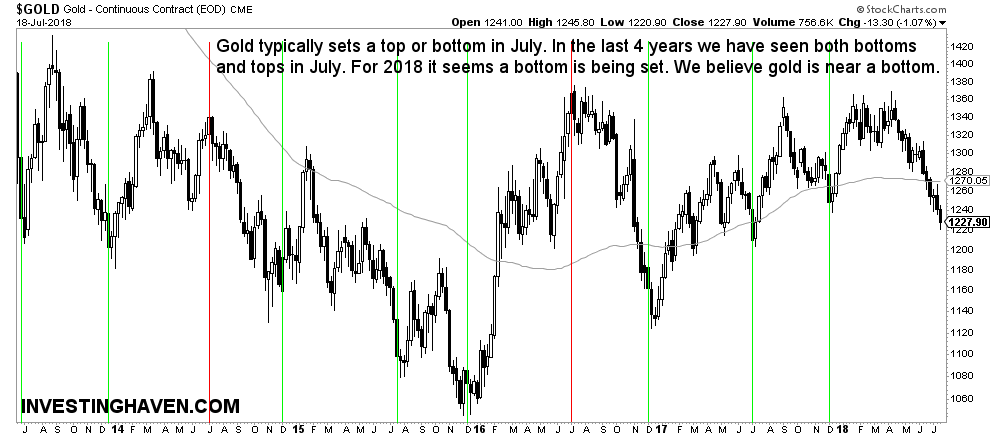
In recent years, as per gold’s chart, we see typically extreme gold price behavior in July. However, even if it’s mostly a major bottom that is set, there have been instances of an intermediate top as well. The first chart shows lines in the important July and December months over the last 5 years, with the green lines representing intermediate bottoms in July and December while the red lines are intermediate tops and they only occurred in July! Not a very clear answer to gold price seasonality for summer 2018.
As the gold price chart does not paints a clear picture we have to look into the Gold COT Chart which we analyzed a couple of times already in 2018. Scroll down to find the COT on the second chart.
Gold price seasonality in 2018: gold’s futures market
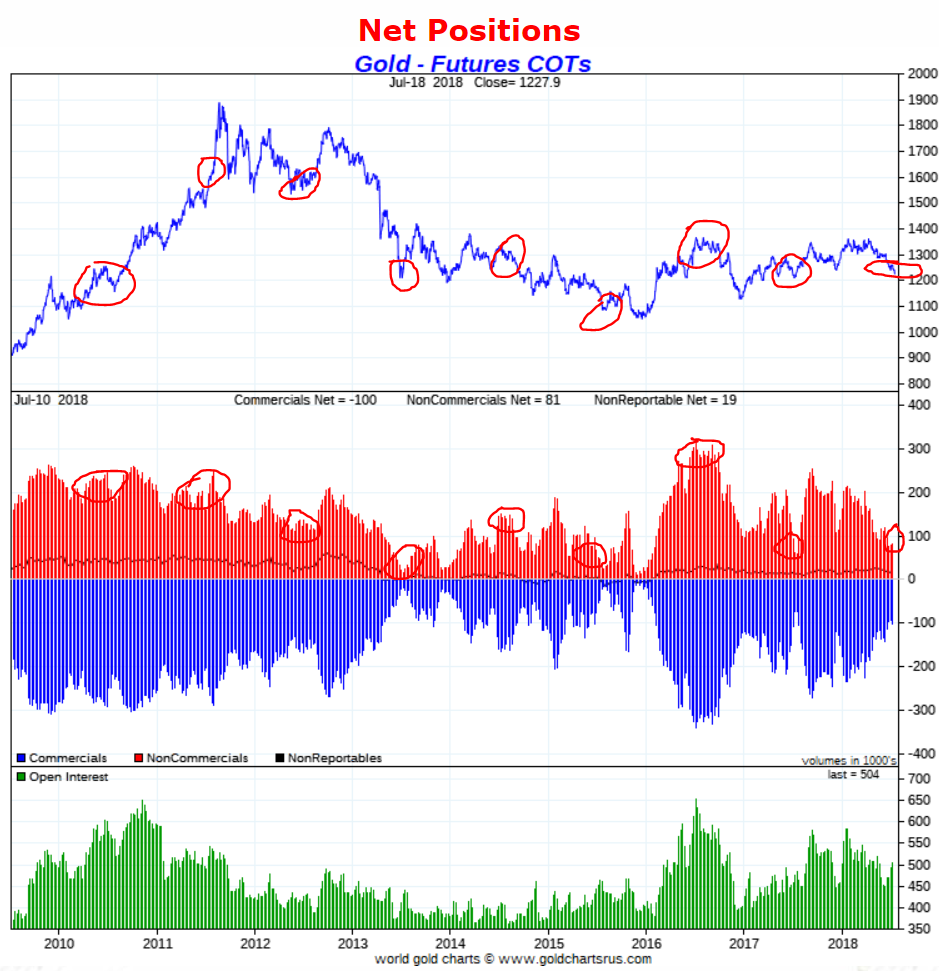
As the gold price chart does not give us we have to look at our leading indicator for the gold price: the futures market and its structure (COT report). The second chart shows the 9 year gold COT report.
We have annotated in red circles the summer period over the last 9 years, both on the gold price chart (upper pane) as well as the futures positions of commercial traders (center pane).
The COT report may be consulted to identify extremes, not for anything else forecast related. It is not a timing indicator, it does not forecast short term, etc. It indicates if the gold market sits at extremes.
This may allow for a better gold price seasonality 2018 estimate.
Note that Ted Butler, someone we really respect for his work and with whom we have been in touch in the past, reads the gold and silver price manipulation in the COT reports. This, however, is outside of the scope of what we try to accomplish. We owe Ted Butler credits for his work, and refer readers to his great work if they are interested in that particular subject.
We tend to see extremes in the futures positions of commercial traders in the month of July. Note these are relative extremes, i.e. against the months before. So the right way to read this chart is bottom-up: starting from the red bars and looking straight up to the gold price.
What do we conclude from this?
Very simple, gold’s futures market shows that commercial traders are close to an extremely low position. That would translate into a bottom rather than a top in the gold price.
Does this mean the gold price cannot go lower? Not at all, the gold price can take a dive towards the $1150 area even in the next few weeks. But we do not see it going much lower than there.
Readers may ask how this is possible as we were talking about a Gold Breakout and a Bull Market in 2018 a couple of months ago. That is accurate, and, as per gold’s chart, we clearly said a breakout was in the making but had to be confirmed. The confirmation never came, so it was a breakout attempt.
Now what seems to be happening right now is a mega cup-and-handle formation on gold’s chart as explained recently. That is a bullish pattern. It is one in which a short term bearish move comes after a breakout attempt just to shrug off all the bears that are still in the market, and continue only with bulls.
We expect gold to bottom this summer before it moves back to its 2018 highs in December!