Junk Bonds, in conjunction with other indicators, could provide decent clues about stock markets future direction. We do not consider it a primary indicator but we are definitely keeping its price action on our radar. Our article today will cover why.
Before we look into the junk bonds performance and what they are indicating, we want to remind our readers that our research team has been reviewing many important market indicators and correlations within a global intermarket analysis especially after the flash crash in S&P earlier this month, February 2018.
We started with the U.S. 20 year yields, a leading indicator for U.S. stock markets, covered the question that was and still is a top of mind for many investors: “Alert, Stock market Crash about to happen” . We concluded that the stock markets are still in a “risk on” period and shared how The small cap index, Russell 2000, an important risk asset seems to confirm as well. As to how is Gold, an important safe haven asset going to perform, we answered the question and provided our Bullish perspective for Gold here.
So what do Junk Bonds indicate for Stock markets in 2018?
Junk bonds are high-yield and risk security, usually issued by companies looking for a quick way to raise capital. They have higher returns therefore are considered a good indicator for risk aversion or appetite in the market.
So during a risk on period, junk bonds are up and reflect the risk taking appetite in the market hence signalling that stocks are or going up.
During a risk off period however, investors avoid riskier setups such as junk bonds and flock towards the safety of government bonds or savings accounts for instance. This setup is usually bearish for stocks as well.
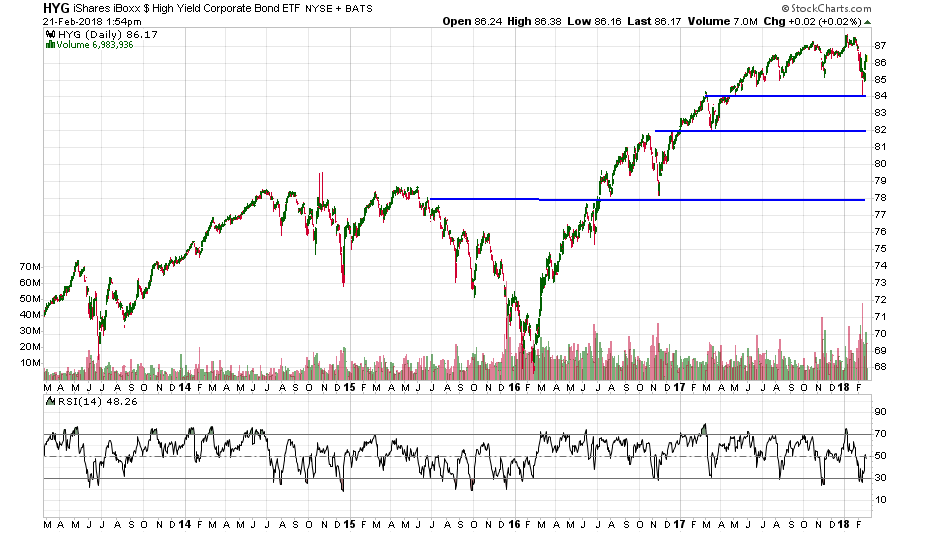
When looking at iShares High Yields Corporate Bond ETF, we see the upwards move that started in 2016. We also see that there are some major support levels built from previous back tests of 3 previous breakout levels.
February’s flash crash marked a successful back test of the 84 level which is Bullish for HYG. However there is overhead resistance that the price needs to overcome, notably at the 87 USD level. We don’t expect to see that resistance broken on the first attempt but there is definitely a strong support which is a positive factor for the price and therefore for the overall positive stock market sentiment.