
The #1 auto manufacturer in the United States (based on market cap),Tesla Inc. (TSLA) designs, develops, manufactures, and sells electric vehicles, and energy generation and storage systems in the United States, China, Norway, and internationally.
This report investigates Tesla Inc. based on a technical analysis point of view to understand the past, present and also what opportunities possibly lie ahead for the purpose of making profits. It is also important to keep three (3) important points in mind.
- Presentation of charts in this report is used to gather evidence(s), while avoiding redundancy to ultimately build a long term trade bias for Tesla Inc. (TSLA).
- Use of technical tools in this analysis is intended to provide an objective point of view regardless of the author’s personal opinion.
- All charts as shown in this report are Weekly timeframes, unless otherwise specified.
Notes, analysis, comments and/or discussions for each chart are provided below the chart with a summary given at the end of the report specifically addressing point #1 given above.
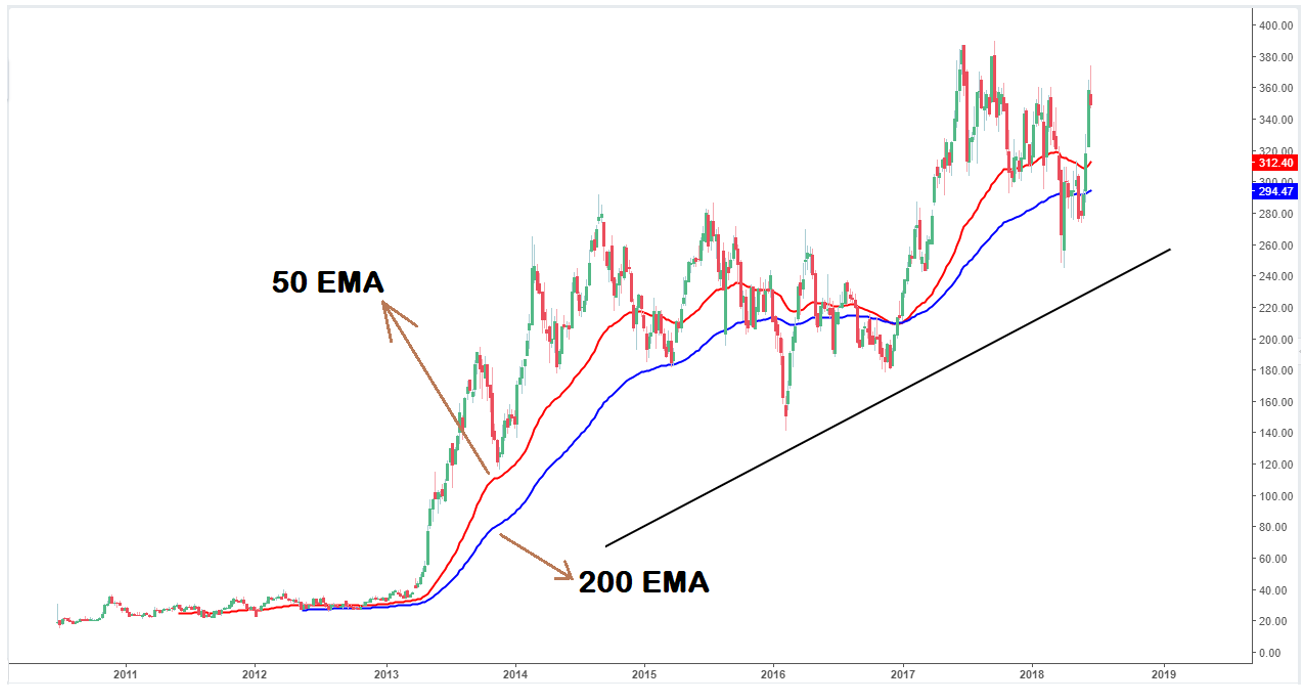
The Weekly timeframe chart of Tesla Inc. (TSLA) as shown above captures price action since the inception of the company. A 200 exponential moving average (EMA) and a 50 day exponential moving average as shown on the chart indicate a “Golden cross” with the latter (50 day EMA) above the former (200 day EMA).
The significance of the Golden cross itself on the Weekly tf chart (a long timeframe chart) is that it indicates that the longer term signal is bullish and moreover, it does provide a way to judge institutional interest with regards to Tesla, Inc. Moreover, the black line as drawn on the chart indicates an overall rising, positive slope for Tesla Inc. The slope of a moving average being its most powerful signal therefore does indicates that there is an overall demand for stocks of Tesla Inc. which would make further increase in price a reasonable expectation.
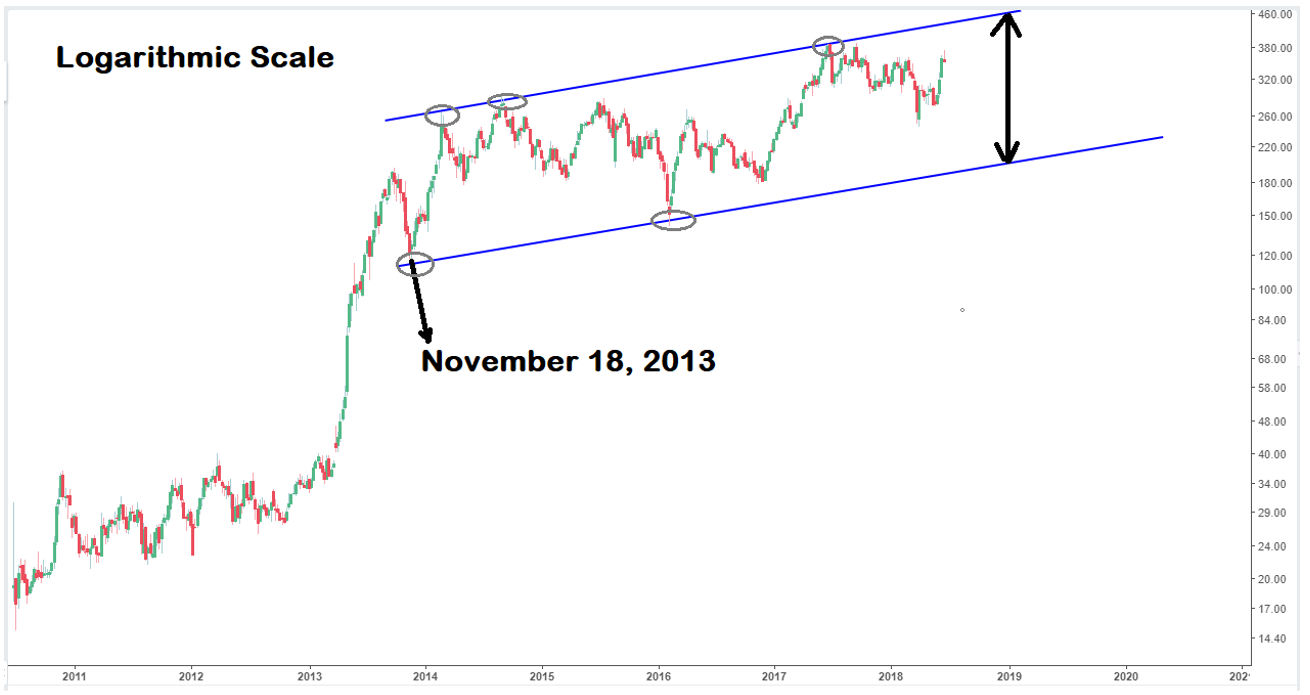
The major reason for using a logarithmic scale as shown above is that it makes chart patterns a lot clearer and easier to work with especially for longer timeframe charts. As indicated on the chart, the meandering action of Tesla Inc. (TSLA) is captured using a price channel with price action entering the channel on November 18, 2013. Grey circles on the chart show price points and/or pivots connected to draw the channel.
Investigating the channel is mainly for the purpose of price projections to help estimate a plausible termination point for the price of Tesla Inc. (TSLA) should it breakout or close above the channel. The black arrow shown on the chart is used to approximate the width of the channel which is crucial for finding future price resistance.

The Average Directional Index (ADX) is a great trend indicator. The ADX line (black color) bottoming and rising out of that bottom as highlighted by the horizontal blue line is one of the most powerful signals of the ADX. The ADX line currently does have a positive rising slope which means that we have a trend in place. The +DI line (in green) crossing above the –DI line (in red color) means the trend currently ongoing is bullish.
The lines marked on the chart are not to be underestimated either as they indicate key support levels for Tesla Inc. (TSLA) should a quick sell off ensue.
The price range for the support levels as indicated by the letters a, b, c, d and e are given below:
- Support a: Between 318.36 and 315.92
- Support b: Between 302.94 and 303.33
- Support c: Between 286.45 and 286.20
- Support d: Between 269.58 and 269.34
- Support e: Between 241.89 and 241.96
The support levels as shown above will be expected to provide support for Tesla Inc. (TSLA). Use of either for the support levels for entering a long position is even far more effective when there is a confirmation from another independent technical signal e.g. Momentum.
Charts shown below are used as an external gauge in achieving point #1 mentioned at the start of this report. Both provide an objective way to assess the general market outlook, and/or the economy as a whole which can drastically affect investor appetite for risk, and also social mood, both of which will impact the progression of Tesla Inc. (TSLA) in terms of price action.

The consumer discretionary select sector (SPDR) fund tracks consumer discretionary stocks drawn from the S&P 500. Consumer discretionary and cyclical are always in tandem during periods of economic contraction or prosperity. Tesla Inc. (TSLA) is considered a consumer cyclical stock (automobile) and therefore, it would make sense to have a quick look at the SPDR selector fund against the S&P 500. It is very obvious to see not only that the SPDR continues to outperform the S&P 500 which it has done convincingly, but also the SPDR just had a technical breakout into even higher highs. The objective facts mentioned above bode well for consumer discretionary and in turn cyclicals of which Tesla Inc. (TSLA) is a part of.

The last but not the least chart that provides a key indication of the economic strength, trend strength for the S&P 500 and other major US Indices are the three Dow Jones Averages i.e. Transportation, Utility and Industrial. All three (3) confirming each other by remaining in a uptrend (bullish mode). The loud and clear message based on the chart of the averages is that there is/are no signs yet of economic slowdown.
The implication of the Dow Jones Averages on Tesla Inc. (TSLA) is the same as that of the SPDR. Coupled with these is that a general move up in the S&P 500 will also play a role in driving prices higher for its constituents.
As mentioned in point #1 at the start of this report, the main goal at the end of the analysis is to build a long term trade bias for Tesla Inc. (TSLA).
Conclusion
Based on evidences gathered above, Telsa Inc. (TSLA) is in worst case scenario going to maintain its current side trend. A clear bullish signal is given when prices move above the previous high made of ~$389.61 on September 18, 2017.
In terms of establishing a long position which gives or pays less attention to price entry point, this analysis favors entering a long term position in Tesla Inc. (TSLA) as soon as possible (most aggressive approach).
Strategies that do give consideration to price entry points for a long term position can be either of the following:
- Wait for a pull back to one of the support levels mentioned above that is confirmed by momentum before establishing a long position
- Enter or establish a long position only after a breakout above ~$389.61 and consolidation in price above the breakout. This ensures that one can avoid a fake out breakout (most conservative approach).
Report is presented by: Tola Ogunniyi


