We got some questions from readers about the uranium market (URA), and, in particular, Cameco (CCJ) as the bellwether stock in the uranium space.
Uranium miner Cameco is going through a bear market, driven by the uranium secular bear market. The company has a healthy financial position, with $135M in cash (on June 30th 2016), earnings per share of $0.36 and revenue of $669M in the second quarter of this year (best quarter this year). The number of shares outstanding is flat, which suggests that the management team wants to avoid dilution of shareholder value.
Sentiment in uranium, one of the key barometers in our methodology, is negative. That is potentially very bullish, but only combined with other bullish factors like a chart breakout on a long term chart which we don’t really see at this point, though we observe a bounce from an important support area as explained on the second chart below.
Uranium Miner Cameco’s complex chart shows the importance of the current price level
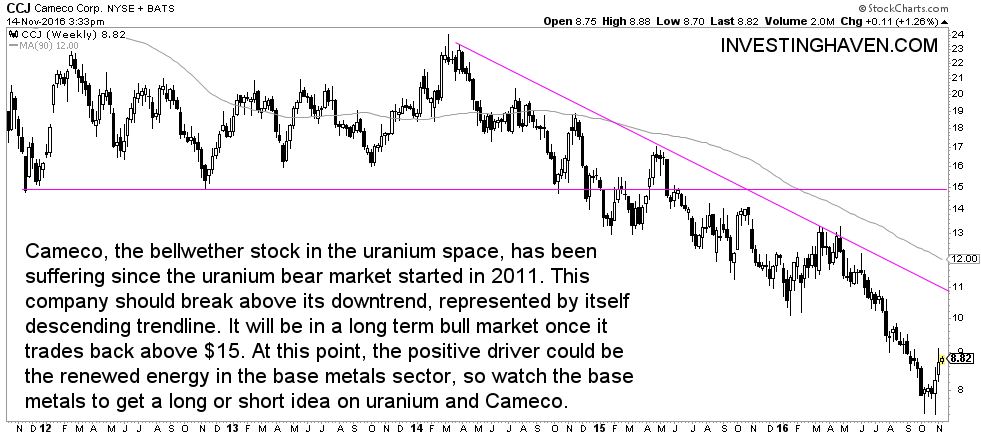
Cameco’s 5-year chart does not look very bullish. It shows a very ugly downtrend, and suggests that the stock has to double before it comes in bullish territory (see the trendline at $15 on the first chart). However, once the descending trendline is broken, right below $11, we could see a tactical (short to medium term) bull market.
As we cannot derive much info from the 5-year chart, we have to zoom out to a longer timeframe.
The long term chart of Cameco has some very interesting insights. First, there is a clear channel visible on the chart (connecting the peaks and bottoms since 2006). The stock sits right at major support at this point within that trend channel. Furthermore, there is a second strong support line which comes in at $8.8 (the peak of 2003). This suggests that the stock price is likely to go higher from here, at least short to medium term, unless it breaks below major support at the downside (around $7.5).
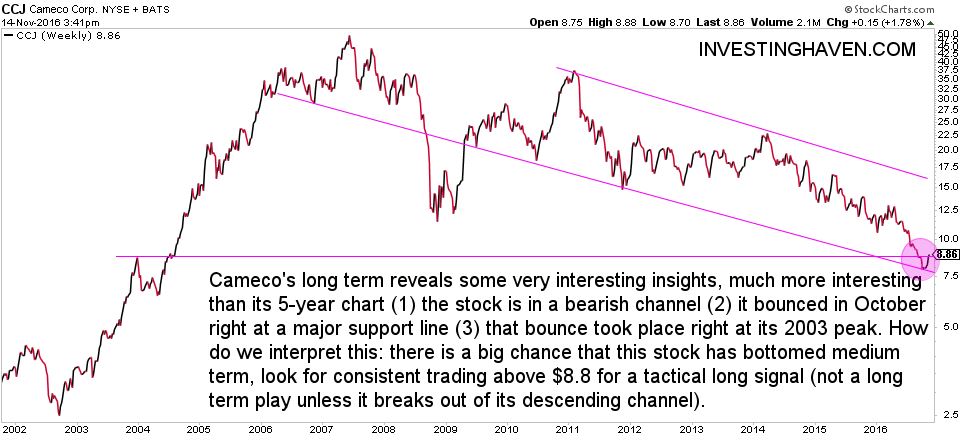
Combining the insights from both charts would bring us to the conclusion that Cameco trades at major support at this point, hinting at a medium-term bottom. If, and that’s a big IF, Cameco goes higher from here, in the coming weeks, we will have seen a major bottom (purple circle on the chart above). There is easy upside potential to $11, and, if broken, till $15 where major resistance will hit. A major bull market will start if the stock will break above $15, but we should evaluate at that point given sentiment and broad market conditions.


