Commodities were hot. Commodities came down recently after hitting multi-year highs, especially agriculturals and some base metals. But that’s not what the commodities chart DBC shows, it is going through a secular breakout test. How comes?
The answer to this question is found here: DBC holdings.
Be careful interpreting patterns of ETFs and other indexes like DBC. You’ll have to understand what they represent, and check the largest holdings.
In the case of DBC there is lots of crude oil and some Ibovespa index holdings. So we cannot reasonably look at DBC and draw conclusion that apply to the entire commodities space.
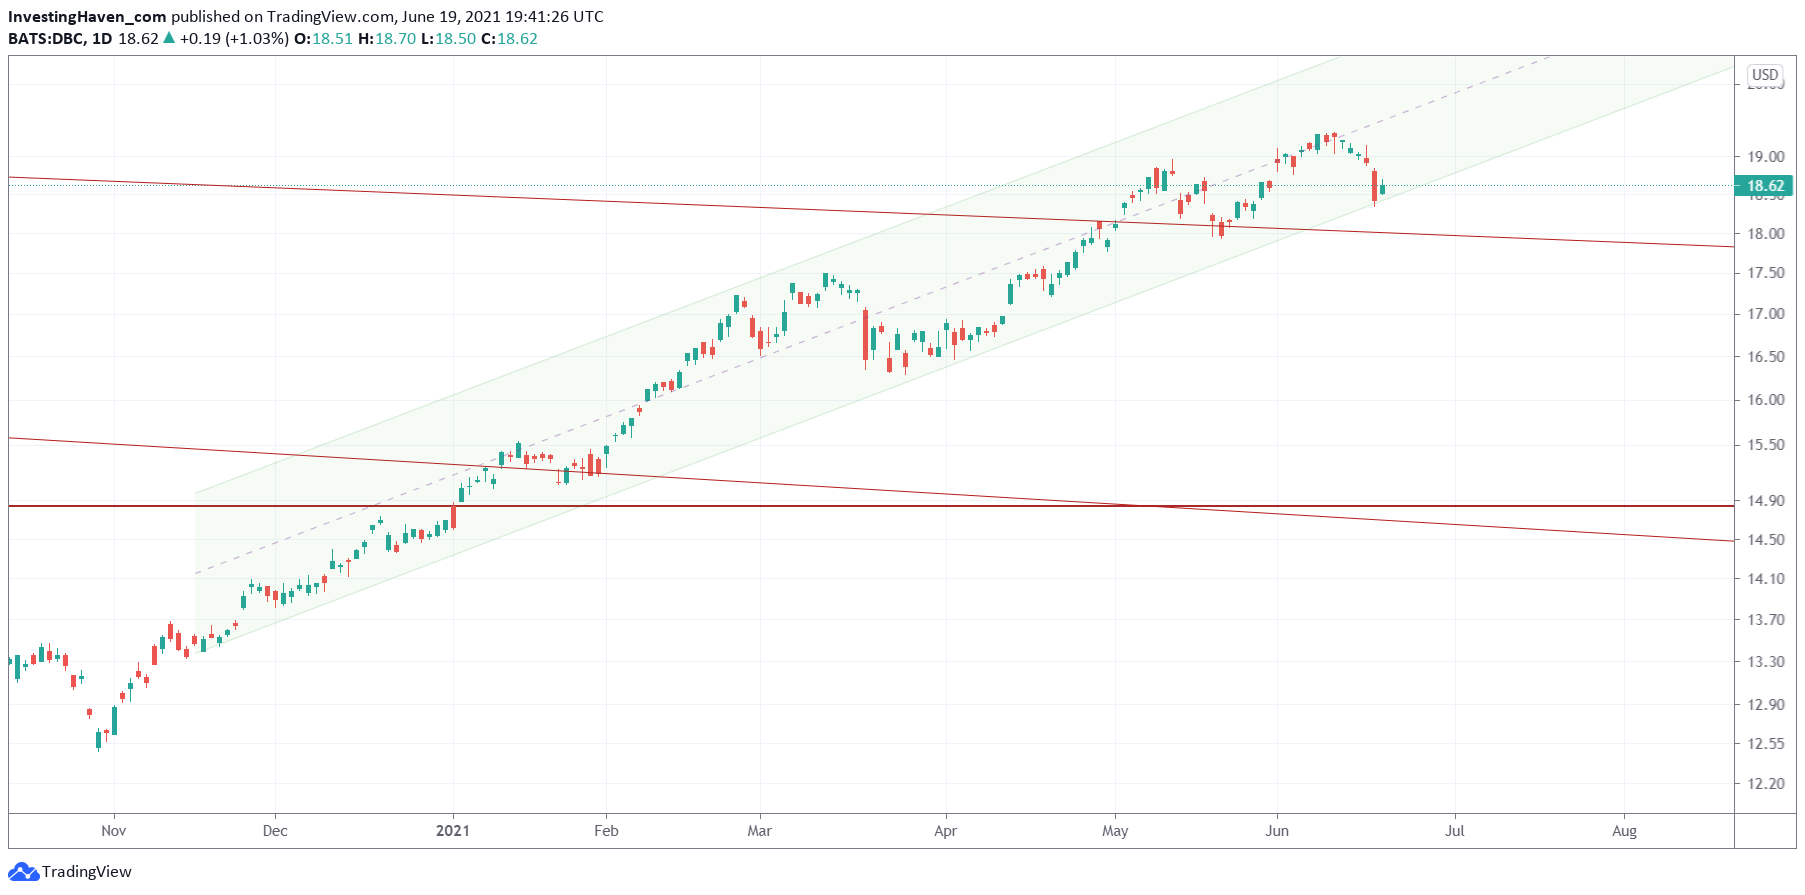
Yes, the daily commodities chart DBC continues to trend higher, in a structured channel.
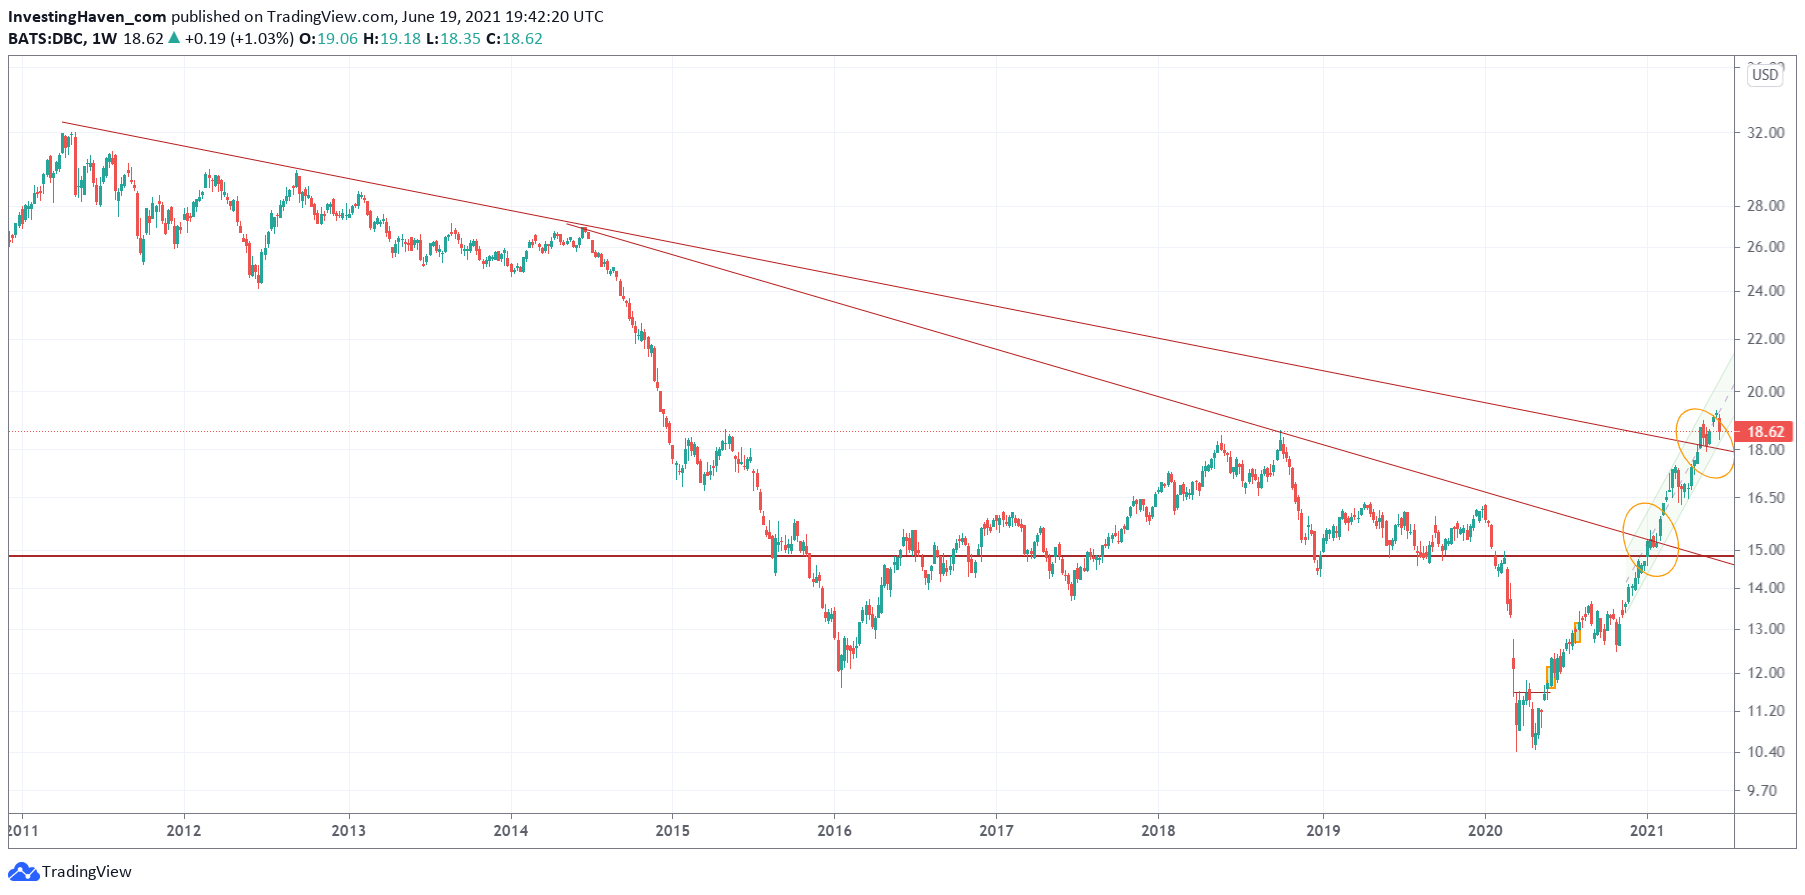
The weekly chart shows a breakout test might be underway: a retracement, if and when it would happen, would bring this chart back to the falling multi-decade trendline which currently coincides with the peaks of 2015 and 2018.
The weekly chart has this giant W-reversal over the last 6 years. The recent rise was a little too fast, presumably, so it might need to consolidate right at or below its secular breakout level.
But remember that this chart is not necessarily representing all commodities. Some commodities are overweight in this index.


