
Since the global commodity markets bottomed in 2020, we saw a parabolic rise in the price of commodities. This rise fueled inflation levels and for most investors today, understanding if the move in commodities is exhausted or not is a top of mind.
It is a particularly important question since we know how commodities, the US dollar, bonds, yields and the volatile equities markets are all intertwined. So a top in one market could signal the bottom in another. Hence why stock market investors around the world are currently watching the price action in this chart: The Commodity Research Bureau Index, also referred to as the $CRB Index.
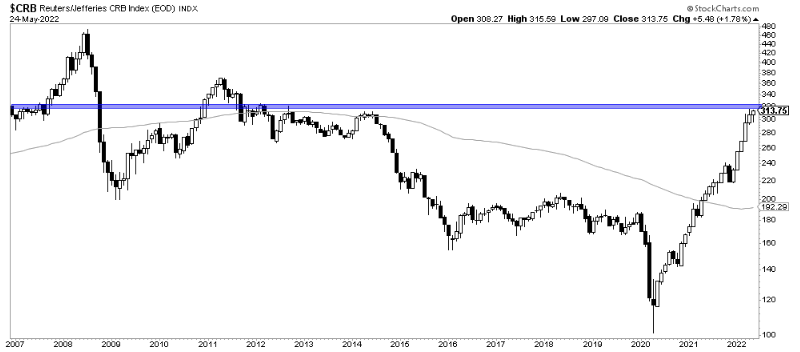
The CRB Index Long Term Chart
This long term $CRB index chart, 15 years exactly, indicates the following:
The price is currently hitting a resistance area between $300 and $370. How the price will act at these levels could indicate if commodities in general are likely to continue their run or roll back here.
A parabolic rise in the commodities index started in 2021 and this section of the chart is extremely important to understand what might be about to happen. When a parabolic arc breaks, you can easily see a decline of 65% to 75% in the price. So unless we see a quick pullback and continuation in the uptrend, this setup if rejected at the above resistance levels could possibly signal the top in commodities and a reversal for equities.
What’s next for the global Commodity markets?
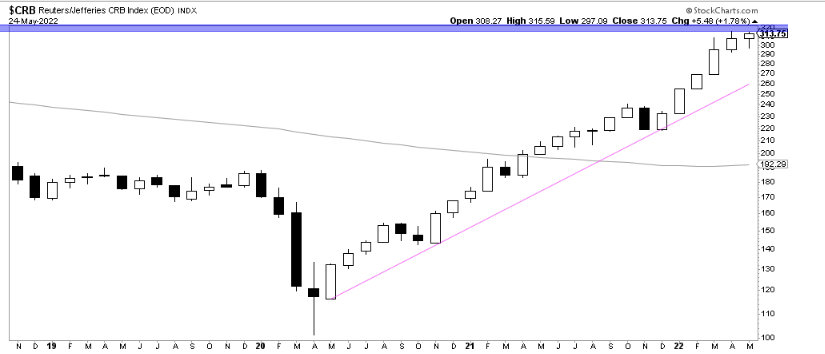
The monthly CRB index chart below is an important indicator that what we will be watching to understand what could happen next in both the commodity markets and equities markets. It is important that we don’t consider it in isolation but rather in conjunction with our leading indicators. That is the only way to draw actionable insights.
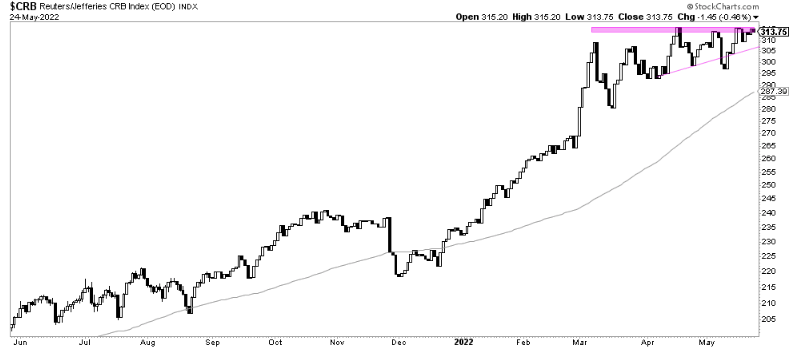
The chart below shows the uptrend in the $CRB is strong and valid. The price however is approaching overhead resistance levels so investors have to be ready for either scenarios. At this point, we have 3 possibilities:
- An upside breakout will be spectacular to say the least. Resistance 1 will be $315 then the true breakout at $370
- Should the price break below $300 (tight stop) or $270 for those with a higher risk tolerance, we will have a parabolic and you do not want to be caught in the downwards movement that will likely follow.
- The 3rd scenario is a range bound price action between $300 and $370 before the price chooses a direction. Likely up given the preceding solid uptrend.
A closer look on the daily shows how there is already a resistance in the $315 area. The higher lows however indicate that the dips are consistently getting bought. The next few days should bring more clarity as we approach the apex of the triangle.
Written by hdcharting, reviewed by Taki Tsaklanos


