Our gold forecast for 2020 and 2021 was very clear in forecasting a bullish 2020 and wildly bullish 2021. We said gold would rise to $1750 in the next 24 months. Has the gold price rise already started? Or is it too early? And what about silver which according to our silver forecast would follow gold higher?
One thing is clear: gold is in amazing shape as 2020 kicks off.
However, we see 2 conflicting trends on gold’s chart. And it’s clear it will be either/or, one of the 2 will materialize.
More interestingly, it is already decision time, and the market will take the ultimate decision the latest next week.
What exactly are we referring to?
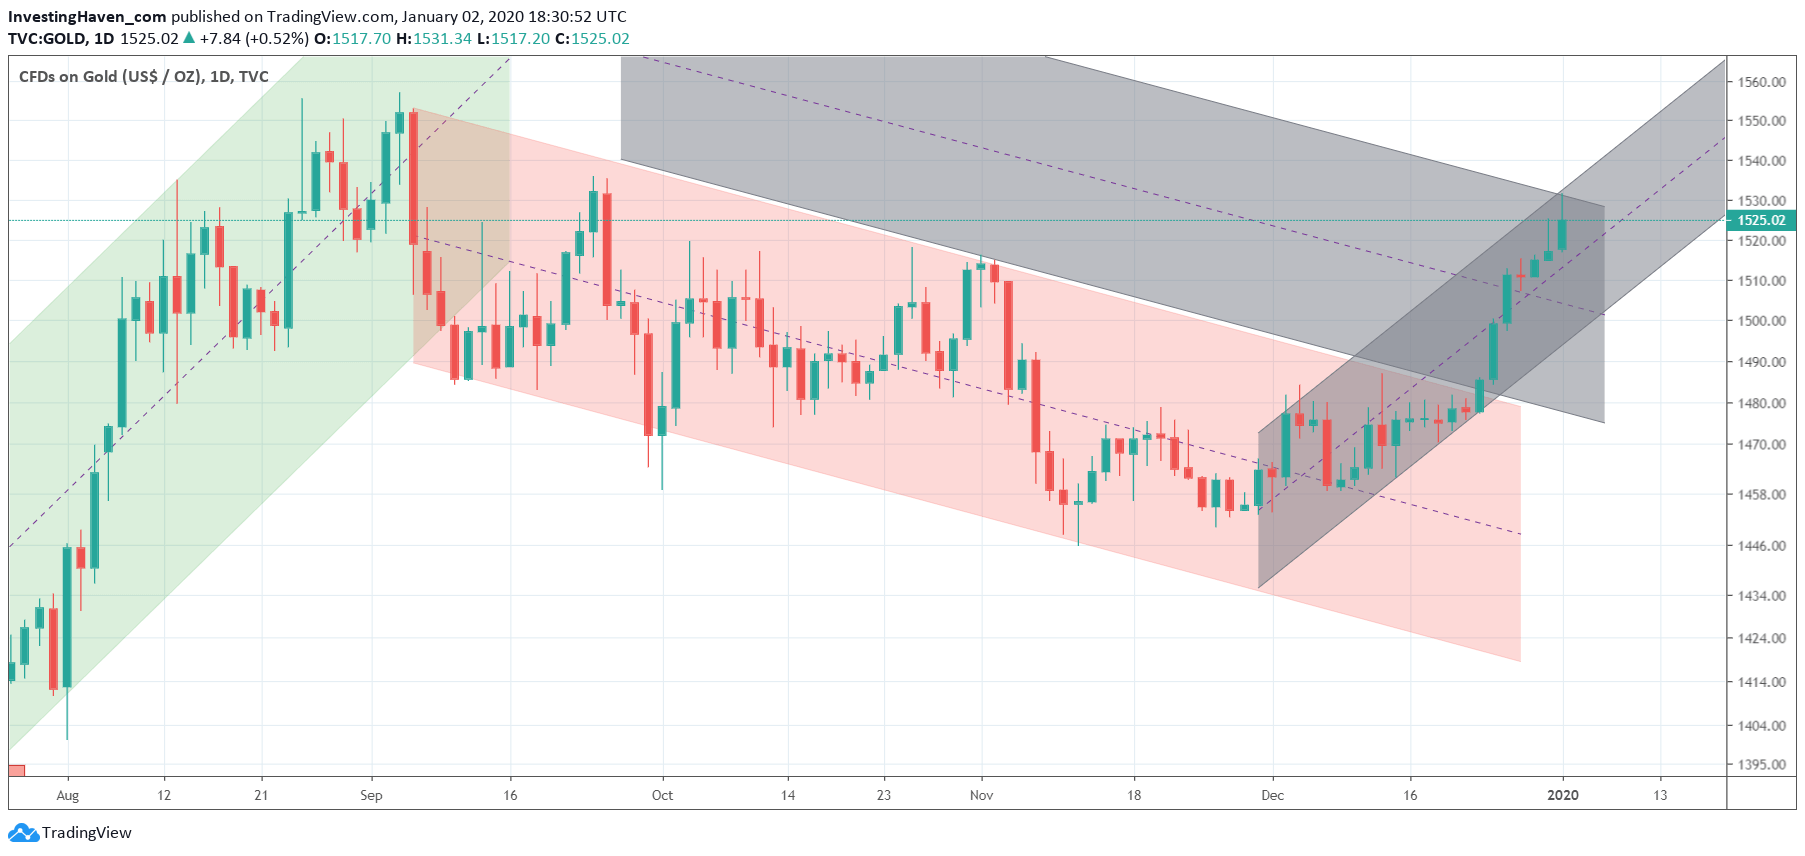
It’s simple, gold is either developing a parallel bearish channel (falling dark grey channel on below chart) or a bullish channel (rising dark grey channel on below chart).
You might argue that this is as obvious as can be. Why do we spend time drawing this type of picture?
Because of the impact that both scenarios will have. The bearish scenario will bring the gold market considerably lower. But the bullish scenario might make the gold market the most attractive market in the first months of 2020!
It’s really that extreme.
The bullish level is 1530 USD, and ultimately bullish support comes in around 1500 USD.
On the flipside any decline below 1500 USD will make gold a big short in 2020. Not likely, but ‘never say never’.