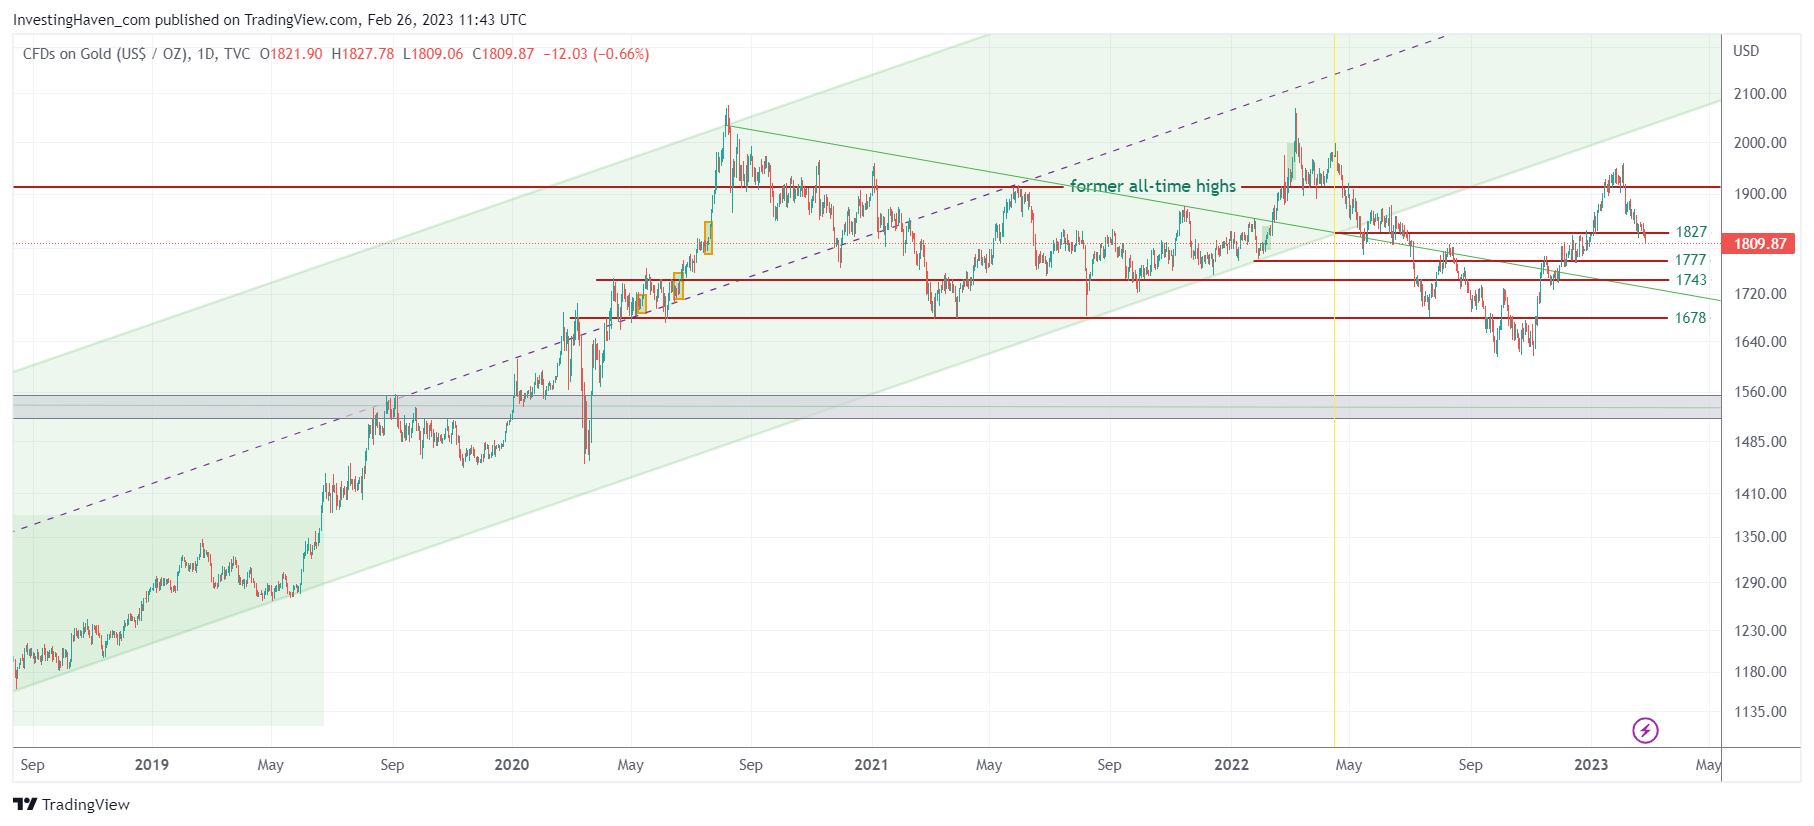
Gold (and silver) have been hit hard in February. We predicted a pullback would happen, and we said it would be healthy, sort of a ‘bullish pullback’. We explained this in Gold’s Healthy Pullback Should Improve Its Long Term Profile. While the pullback is still working ‘in full force’ we start seeing how the gold chart is turning beautiful, obviously provided key support levels will hold.
In our Gold Price Forecast 2023 we predicted that “gold will have a strong bullish cycle which will bring gold close to or back above $2,000“. This forecast was published in Oct of 2022, when markets were insanely volatile and the entire world was convinced that an epic recession was imminent. In a way, our 2023 prediction is already hit.
We also wrote:
We strongly believe that gold’s dominant trend is long term bullish. However, with monetary policies being restrictive as 2023 kicks off creating a disinflationary trend, we see gold consolidating in 2023 before hitting new ATH at a later point in time.
In the end, that’s what matters, the long term trend. We are investors, not traders.
But the point we are trying to make is that we believe that gold will re-attack 2000 USD/oz, still this year. It might take several months, maybe a few quarters, but gold is expected to consolidate before moving back higher.
The long term gold chart makes that point, in our view, provided 1743 is going to hold on a 5 day closing basis.
This is in line with what we explained in Gold: Close To Decent Support Levels:
If the last point is what the market is working on, then you can be sure that support level 1777 and the green falling trendline will hold. In that scenario gold will move back to 2000 USD/oz and clear that level, in the 2nd half of 2023.
That’s what we continue to see: a nice consolidation in the context of what is becoming a giant consolidation, the one that started in Sept of 2020.
So, when your eye is focused on the long consolidation, as seen on below chart, the gold chart turns beautiful. We’ll stick to that beautiful view, it will invalidate if and when gold falls below 1678 USD/oz for more than 5 consecutive days.
Until then, we are long term bullish gold and super bullish silver.
RECOMMENDED READING: Silver: 4 Structural Changes That Confirm The Start Of A New Secular Bull Market.


