Gold’s (GOLD) price fell 1.64 pct on March 1st, 2019. That’s not a good start of the month, for sure. Several followers reached out to us, asking if this is a reason for concern, and if our gold forecast is invalid as gold’s 6th breakout attempt failed? Not that fast, we believe some gold investors are over reacting. Our 100 investing tips are clear on emotions and on the focus on the longer term. Precious metals are still a top candidate for our 3 most juicy investing opportunities this year.
Admittedly, we assessed a high probability (published just two weeks ago) of gold breaking through this stubborn wall of $1350. We said:
Gold attempt n° 6 to break its 6-year bear market wall coming. We feel strong that this time will be different!
First of all, it is not a fact that this attempt has failed.
But even if it fails there is still no reason whatsoever to be concerned.
Gold: Opportunity in March 2019, No Reason To Panic
The big problem we see for investors is their continuous focus on the very short term price changes combined with the endless stream of news in financial media and social media. It is creating such a blurry view for investors that they cannot think clearly any longer.
Let’s look at some examples of today.
Reuters says that gold is on its way for the worst week since May 2017. Really, and what does this mean for gold investors? Does it mean there is more downside, and if so how much? Unclear!
Still people get caught up on these news items, and they take it seriously.
In a somehow similar fashion Marketwatch says in their latest gold update that the price of gold dropped after U.S. GDP data were publihsed as they came out better than expected. So what? There is no correlation on the long run between both, on the contrary!
And then here is our favorite topic, also by Reuters. Venezuela’s central bank is moving 8 tons of gold … so … Indeed, so what? Supply of physical gold really says nothing, absolutely nothing, on gold’s price.
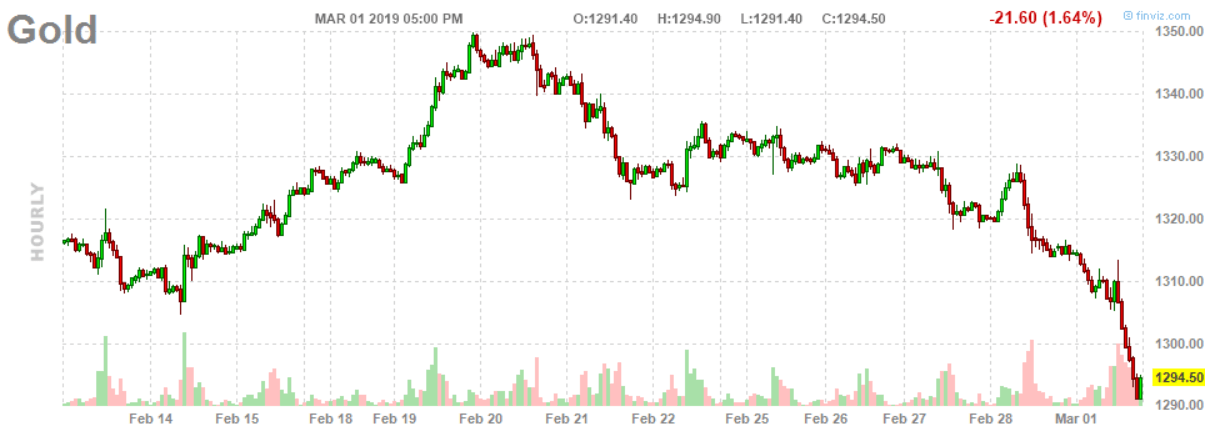
Moreover, if investors focus on the short term price chart, like the hourly chart below which indeed shows an ugly pattern it may have catastrophic results.
We urge gold investors not to over react, take a step back, and stay focused on the big picture.
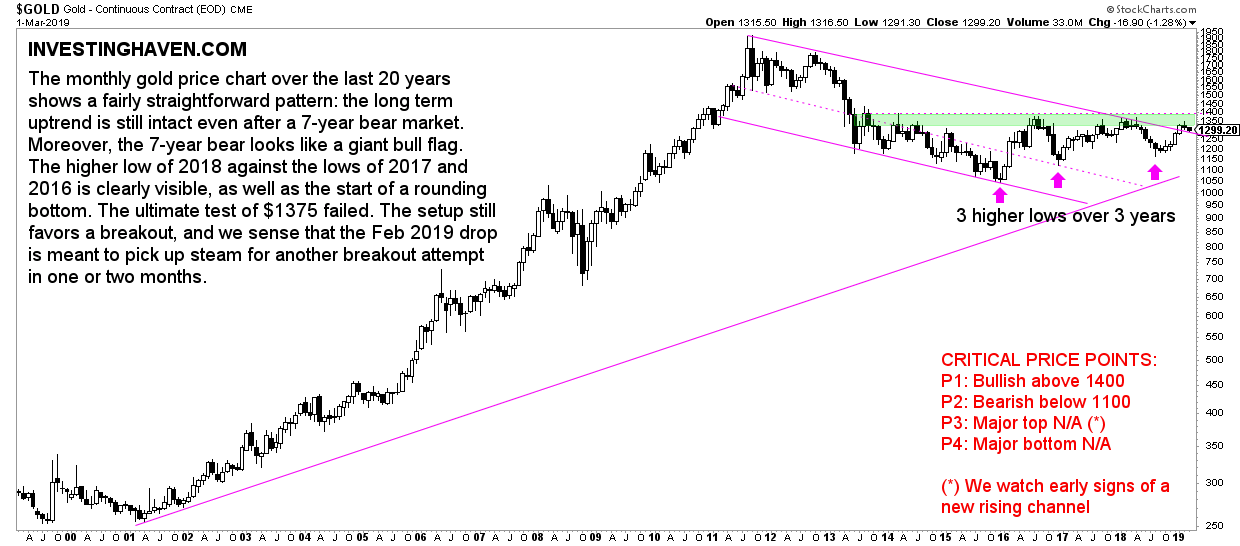
If we review our gold price chart, the monthly chart, we see how gold indeed failed to get back above the important $1375 after its attempt to break $1350 got rejected. Gold is now moving between this giant wall (green bar) which is the bear market wall. It is still trading ABOVE its falling support line.
Moreover, one of our 3 leading indicators for gold, the COT report, shows no extreme levels whatsoever.
Note that this is not a timing indicator. It is an indicator that suggests extreme levels may provide resistance or support on the long term price chart.
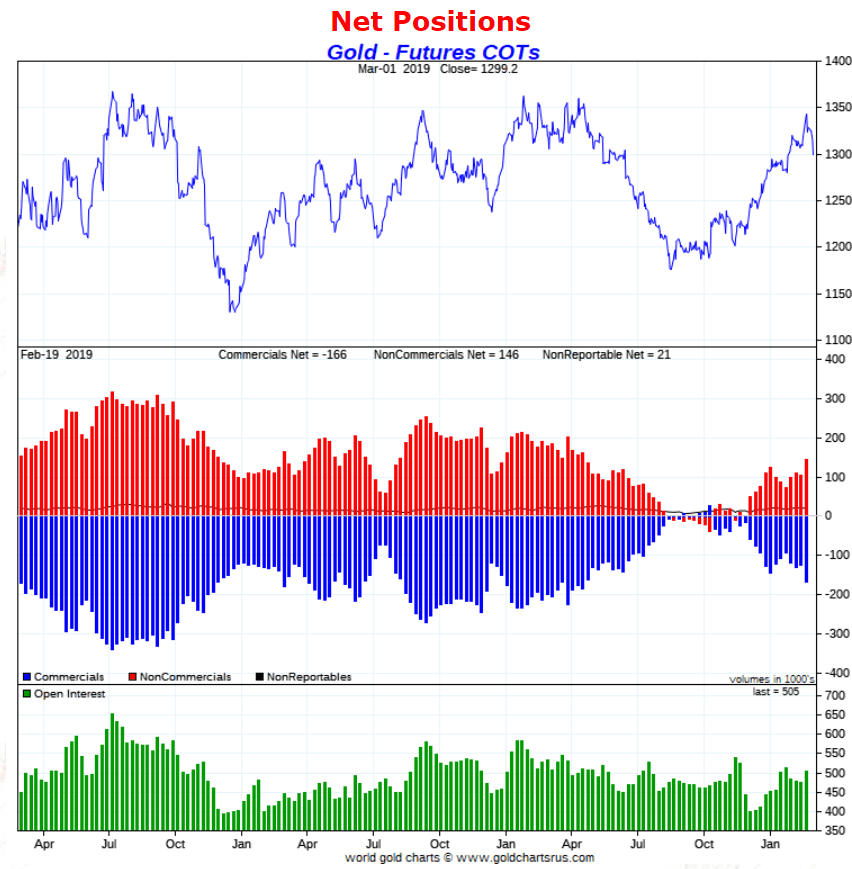
Short term stopping power may be there, but not yet long term stopping power, says the COT report according to us.
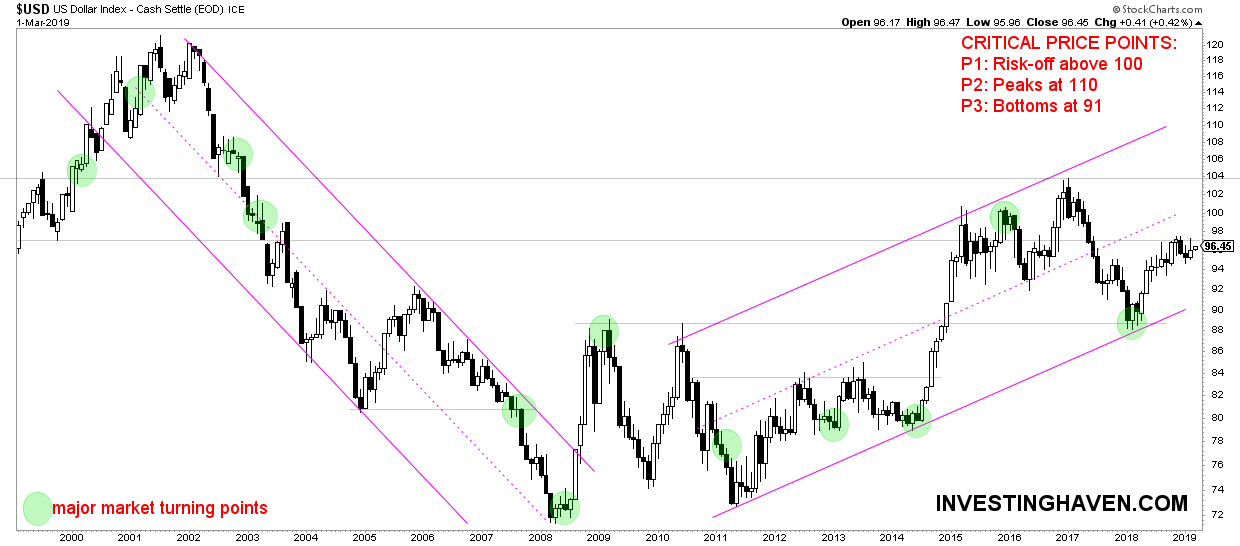
Visibly, the US Dollar is trying to make its way higher. There may be a move to 100 points which is a 4.5 pct increase. But then again the bond market is not yet confirming a major move in the dollar.
Again, same conclusion, let’s not overreact when it comes to gold!