
This is our popular annual gold price forecast. What to expect from the price of gold in 2019 and 2020? Can we reasonably do a gold forecast with specific price targets? In this article we look at our leading indicators for our annual gold price forecast. It turns out that our gold price forecast for 2019 is bullish provided $1375 is broken to the upside. Our gold price target for 2019 is $1550. We also quickly touch up top gold stocks for 2019 as part of gold investments to consider in 2019. This setup is confirmed in our top 3 long term gold charts.
[Ed. note: This gold price forecast 2019 article was originally published on September 16th, last year. Readers can verify this by checking the dates on the charts. Throughout 2019 we will continuously update this gold price forecast, every 4 to 8 weeks. The new updates will appear at the bottom. This way followers can track how this market evolves. They can also track the performance of our initial gold price forecast. With every major update in 2019 we also update the publish date. Last update of this gold price forecast: April 16th, 2019.]
Gold price forecast 2019: leading indicators
Note that any gold (GOLD) price forecast is a challenging task because there are plenty of variables that might play a role. Moreover, gold has traditionally done well under a variety of conditions.
For instance, the 2002 to 2007 rise was primarily due to falling interest rates and a rising real inflation rate combined with a ‘risk on’ market sentiment. That’s opposed to the 90ies when there was ‘risk on’ but interest rates were essentially flat on an annual basis.
On the other hand early precious metals prices rose in 2016 primarily triggered by the fear trade.
Sometimes gold can rise because of fear, but for gold to rise on the gold long term there must be some rising real rates. That makes our gold price forecast somehow more specific.
In sum, we do not recommend to get caught up in the endless stream of headlines. It will only confuse investors. Some recent examples include this imaginary correlation between retail sales and the gold price, physical demand in India vs the gold price or even gold miners influencing the gold price. That’s really not how it works, and we urge serious investors to stay away from the clutter!
Leading indicator #1 real rates
So the first leading indicator is real rates. As seen on the long term rates chart (see here, not embedded in this article) 20 year Yields in the U.S. are clearly rising after a giant rounding bottom was set starting in 2012. This suggests inflation has to rise stronger than rates in order to have an inflationary environment.
Looking at inflation, in both government data as well as shadowstats, we see a similar trend: higher. Inflation stats here. It is the trend that is interesting to us, not the absolute data.
Real rates and inflation will likely be rising in 2019. Real rates may be rising but it will likely not be significant unless something unexpected takes place which changes the current trends.
[Ed. note on April 16th, 2019: Rates have fallen considerably in the first 3 months of 2019. This should have been supportive of the gold price, but rates went up in March and stabilized in April of 2019. This volatility is not very supportive for gold’s price, and logically gold’s price fell in March and stabilized in April. However, inflation in general seems to be stabilizing as well after it set a giant double bottom against 2016. This should be supportive of gold’s price, maybe not in the very short term but medium term, still in the second part of 2019 in our view. ]
Leading indicator #2 Commitment of Traders (COT)
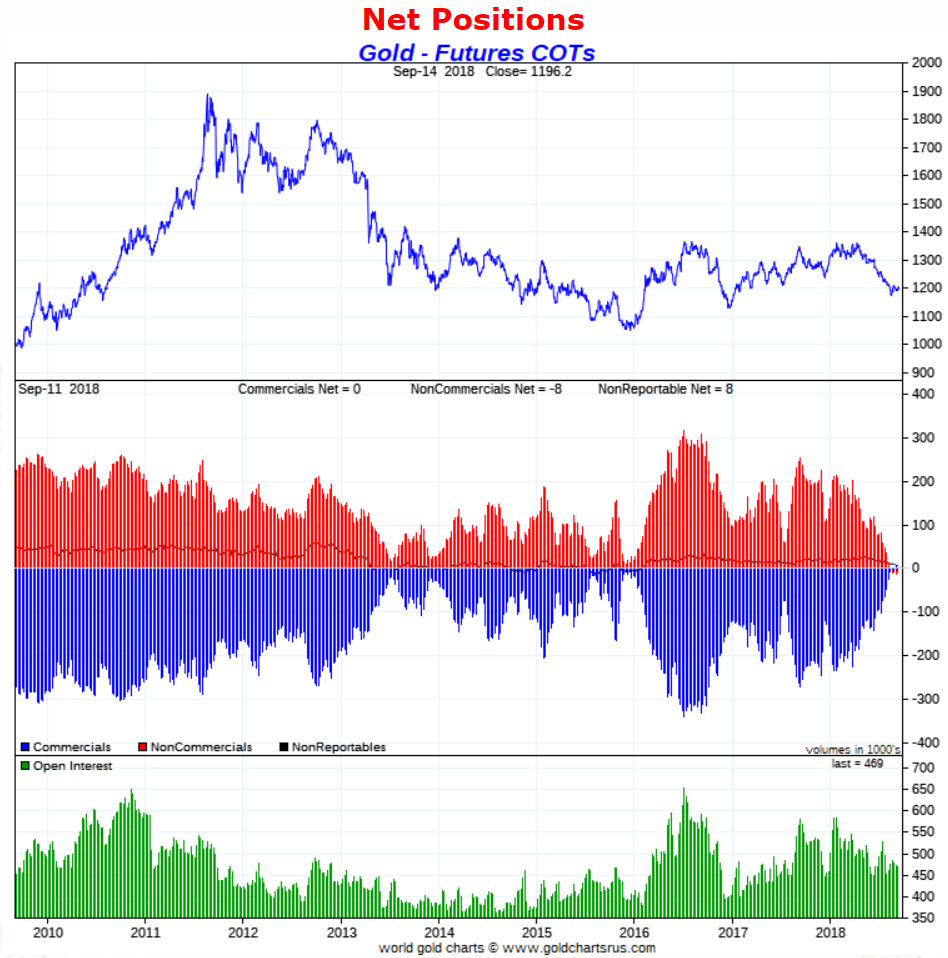
The second leading indicator in our gold price forecast for 2019 is gold’s Commitment of Traders report, in short COT.
Based on the COT report we see that the downside in the gold price is extremely limited. How can we know? Look at the positions of the largest market participants (middle pane). The number of long contracts of non-commercials is at the lowest point in 9 years (red bars). This is not only historically low, it is even exceptional. It suggests that the downside in the gold price is extremely limited. Note this is a medium term forecast, it cannot be take for granted for the full year 2019.
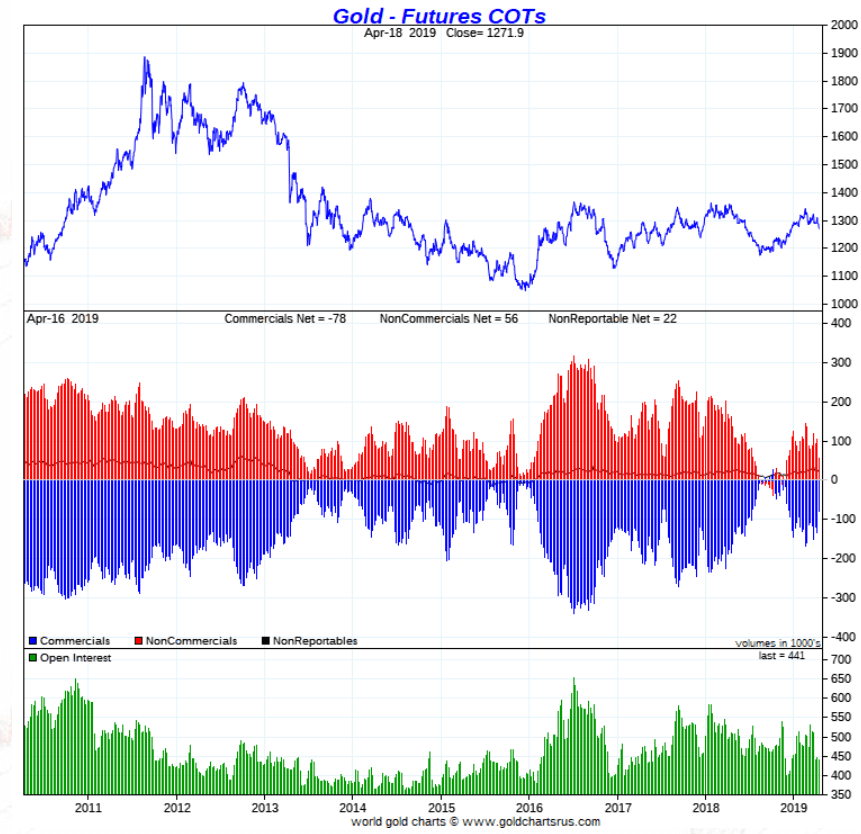
[Ed. note on April 16th, 2019: This is an updated version of the gold COT chart. We added this on April 16th, 2019. It really shows the evolution of the gold COT report, specifically the positions of market participants as visualized in the center pane. After a rise of non-commercial net positions to the +150k area their positions have come down to +50k now. As this is falling towards extreme positions, net close to zero, we believe the downside potential of gold is limited. We expect the decline in gold’s price to end soon, ultimately in the summer months of 2019.]
Leading indicator #3 Euro
Our third leading indicator in our gold price forecast for 2019 is the Euro.
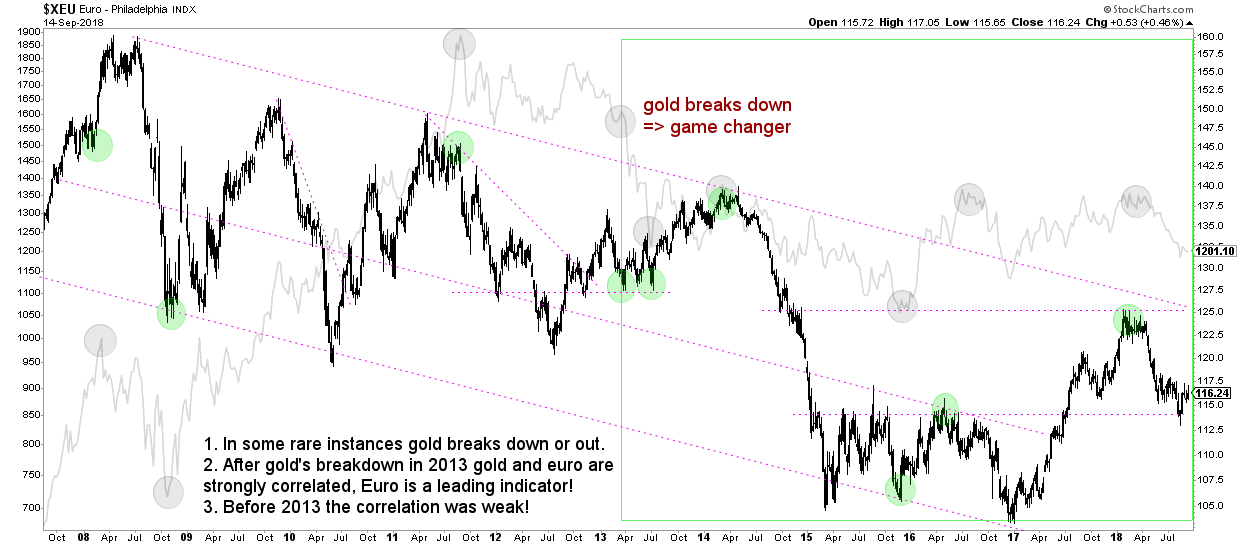
The next chart shows the correlation between the gold price (light grey) and the Euro (black). Moreover, important turning points in the gold price are indicated with light grey circles, and how they map to the Euro is visible in green circles.
What’s clear is that the gold price breakdown of 2013 was a game changer. Before that point, the correlation between both was neutral to weak. Since then, however, there is a very strong correlation between both assets.
More importantly, in recent years, the Euro has been leading the price of gold. Every time the Euro tested secular support or resistance, or broke out or down, it preceded an important top or bottom in the gold price.
For 2019 it seems that the Euro is moving in no man’s land, at least based on the current trend. The Euro has a track record of moving fast once it breaks out or down. Also, near secular support or resistance it tends to stay there for a while. Currently, though, we don’t see any of this.
Note that the Euro chart must be watched closely in 2019 as it may determine major trend changes in the price of gold, impacting directly our gold price forecast for 2019!
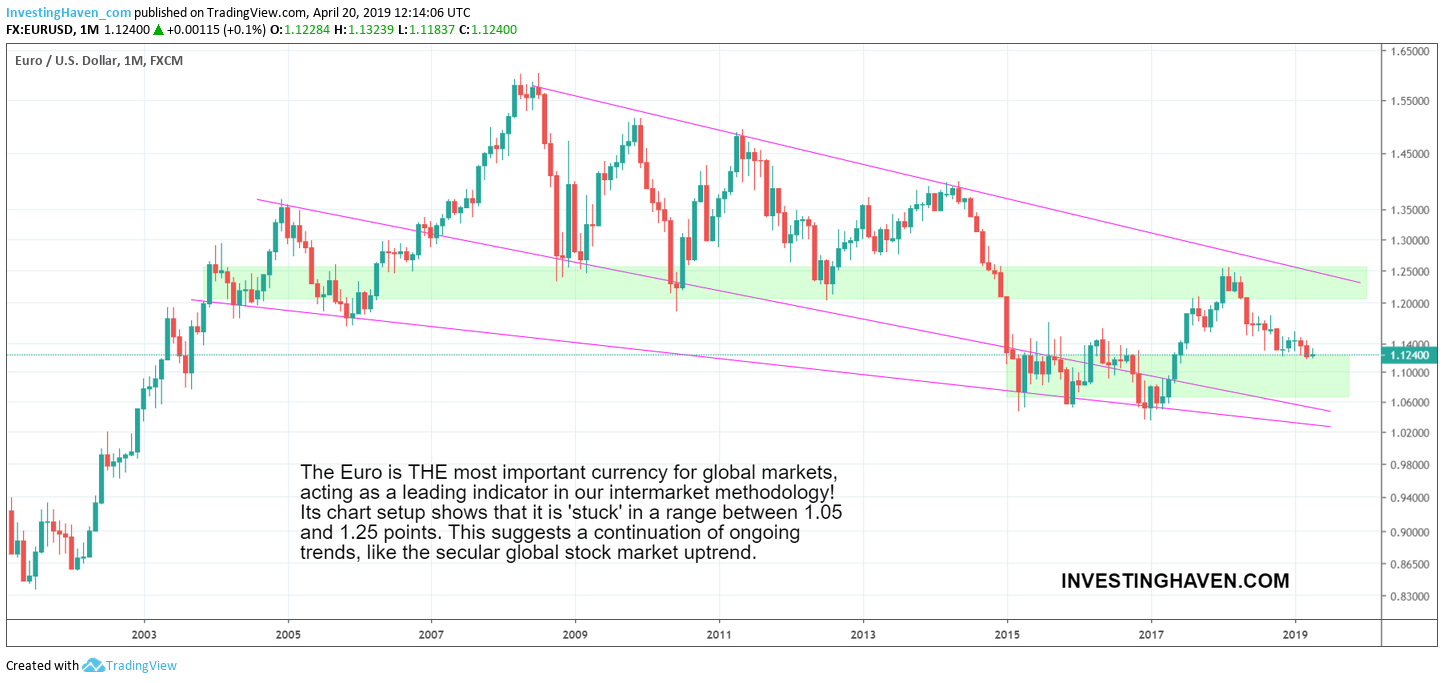
[Ed. note on April 16th, 2019: This is an updated and different version of the Euro long term chart. We added this on April 16th, 2019. It really shows that the Euro is not working ‘against’ the gold market. A rising Euro should have been better, but a mildly falling Euro is simply not supportive of gold (not more than that). We expect the decline in the Euro to end anytime soon, there is some 6 pct more downside but not much more according to us. Any move higher in the Euro towards the 1.22 area will spur another rally in gold’s price.]
Gold price forecast 2019: base case price target
Our leading indicator analysis above suggests the following for our gold price forecast for 2019: the COT report says gold is near a major bottom and that gold will not dip below $1200 in the next few months going into 2019, the real inflation rate is mildly bullish, the Euro is not showing signs of wild moves.
We combine this with major chart structures on gold’s chart in order to do an educated gold price forecast for 2019.
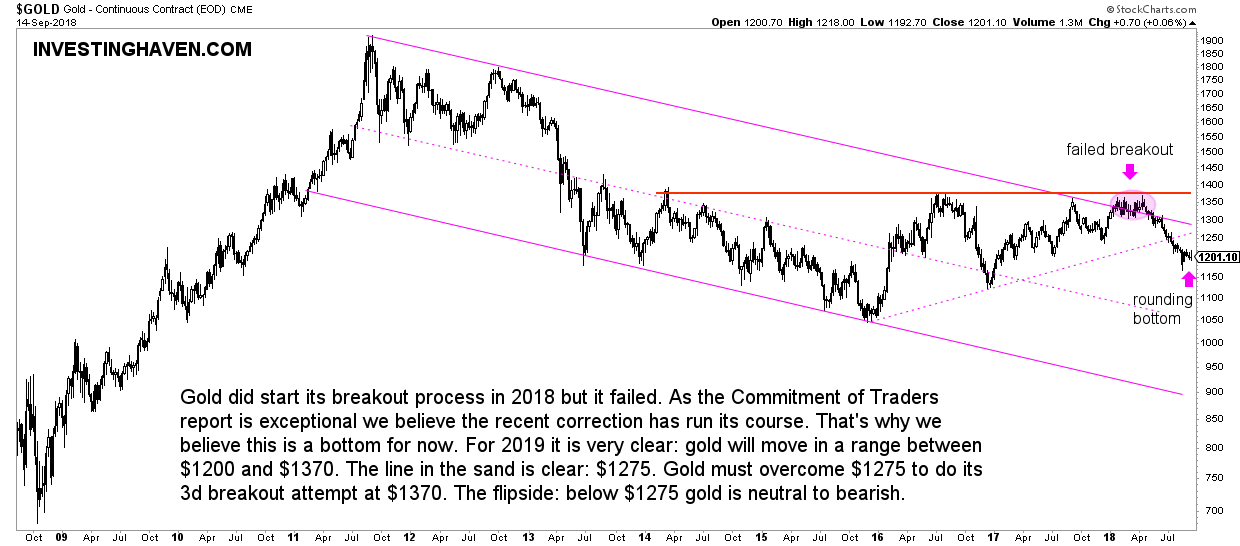
The gold price weekly chart shows this triangle pattern in recent years which is part of the major corrective channel since 2011. Visibly, there was a failed breakout from the correction in 2018. The recent breakdown might also be failed because there is a clear rounding bottom which likely is the result of extreme readings in the COT report.
We tend to believe that the price of gold will go up to the $1300 area in 2019.
Moreover, it is clear from this chart that gold is setting a range, and it will be an important point in 2019: the $1200 to $1375 range. Below $1200 is bearish, we can hardly believe gold will stay below $1200. Between $1200 and $1275 is more or less neutral. Above $1275 is mildly bullish. Above $1375 is wildly bullish.
Our gold price forecast for 2019 is based on the major cup-and-handle gold chart formation. The recent breakdown marked the start of the handle. We believe that gold, in this formation, will go back up in 2019 to test the $1300 to $1375 area. As that will be the 3d attempt for gold to break out of its strong resistance (red line on the chart) there is a fair chance gold will succeed.
Gold price forecast 2019: bullish price target
That’s why our most bullish gold price forecast for 2019 is $1550 (20% probability). This only will happen if it breaks through $1375. The $1375 test is a base case scenario (75% probability).
As part of our #gold price forecast for 2019 we see gold moving to the $1300 to $1375 area. As this will be the 3d breakout attempt there is a fair chance it will succeed: our bullish target for 2019 is $1550. $GLD Click To TweetOn the flipside, any failed attempt to stay above $1200 will be the bearish scenario, and it might take gold to $1050, though the least likely in our opinion (less than 5% probability).
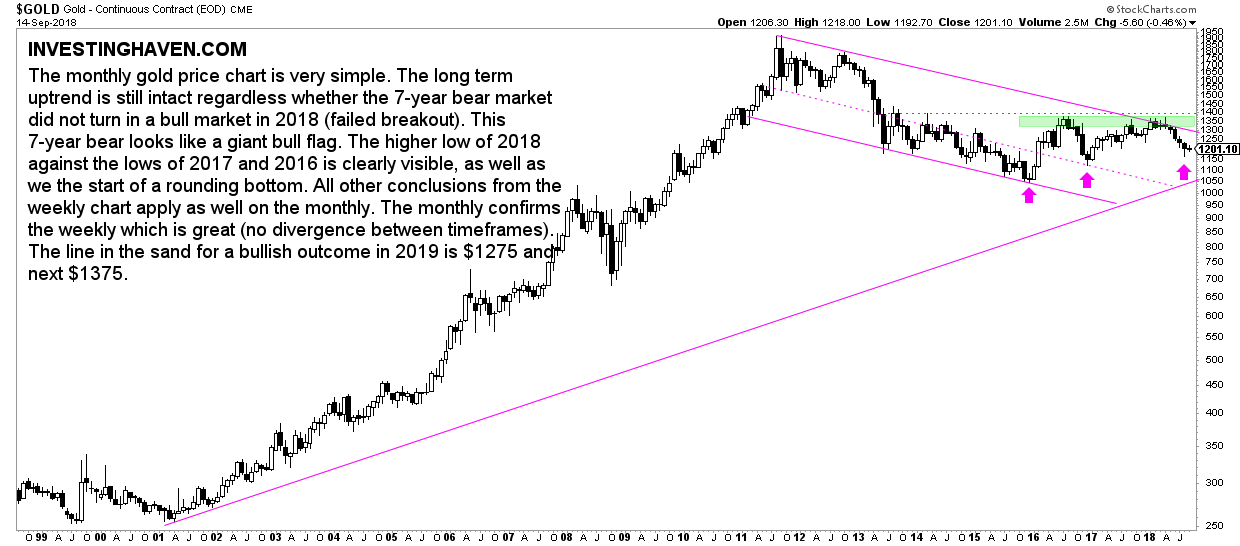
The gold price monthly chart does not reveal any new insight. It confirms the weekly. As long as there is no divergence between timeframes we consider it a good thing. All comments are annotated on the chart below.
Gold stocks in 2019: a once-in-a-decade buy opportunity
That said, we believe that gold stocks are near a once-in-a-decade buy opportunity. We wrote about this at length in our Top Gold Stocks for 2019 update.
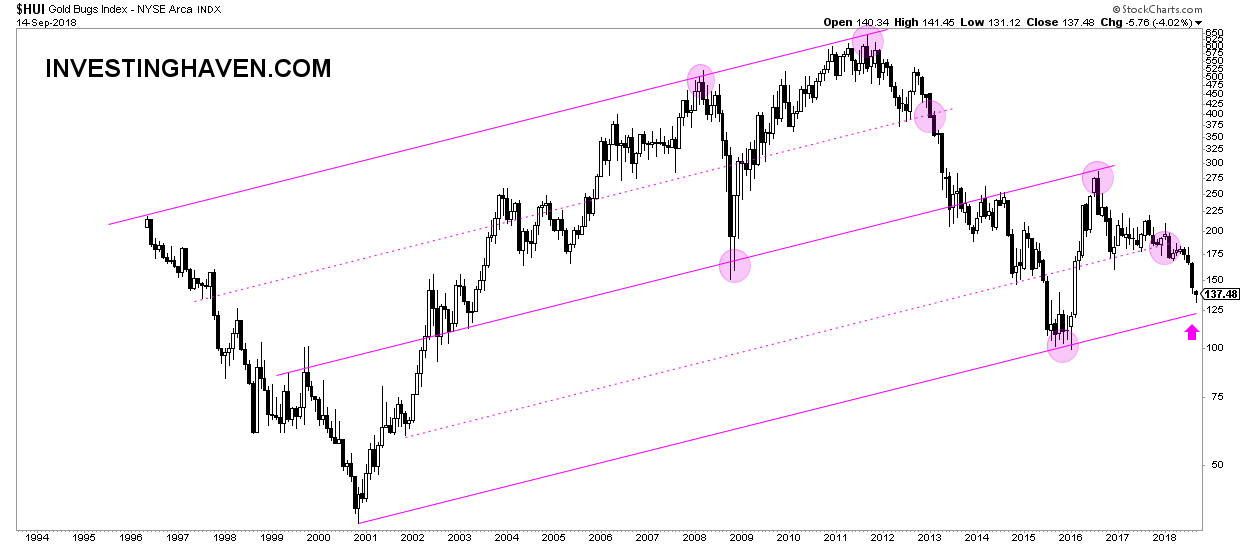
Look at the gold miners index, monthly chart. It shows how peak to trough gold stocks have corrected 79% since their peak in 2012. This clearly is a buy area. The time gold stocks will trade near their secular support is unknown, it may vary from a couple of weeks to a couple of months, depending on how fast the gold price moves back above $1300. But, one thing is clear, if gold surges above $1300, and, ultimately, above $1375, we will see wild moves higher in 2019 in the oversold gold stocks market. Stay tuned, as we will publish our gold stocks forecast for 2019 anytime soon.
** Update on January 3d, 2019 **
Risk-on in the gold market about to accelerate, gold forecast 2019 materializing
We wrote many updates in recent weeks on the gold market, closely following how our gold price forecast 2019 is materializing.
There is this one indicator in the gold market rarely featured which is looking extremely interesting at the time of writing (January 3d, 2019): the junior gold stocks to gold price ratio. This ratio tells us something about the willingness of market participants to take risk in the gold market.
- If the junior gold stocks to gold price ratio rises it points to risk sentiment dominating the gold market, also in 2019.
- If the junior gold stocks to gold price ratio breaks out from a consolidation or a falling trend it means risk sentiment entering the gold market.
Below cart shows that this ratio is breaking out, after a long and vicious bear market which is reflected in the 7-year falling trend of this ratio.
A tiny push higher in the gold stocks sector compared to the gold price will create a breakout on this indicator, which, as said, will lead to a strong appetite for risk in the gold market in 2019.
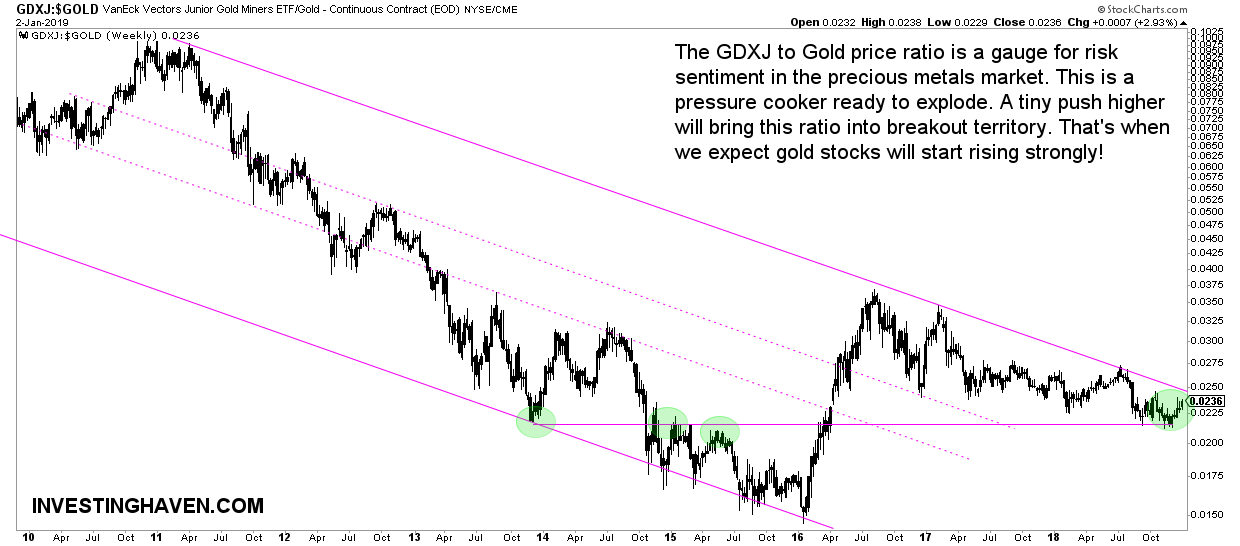
The GDXJ to gold price ratio is a gauge for risk sentiment in the precious metals market. We closely watch the 0.0245 level for a giant breakout, and want to see at a minimum 5 consecutive trading days above this level in order to confirm this breakout.
** Update on February 17th, 2019 **
A giant breakout in precious metals about to take place, suggesting our gold price forecast for 2019 is underway
Massive breakouts in the precious metals place are taking place now. One of them is the junior gold miners to gold price ratio featured below. More on that later.
First, though, the one chart that needs to break out is the price of gold.
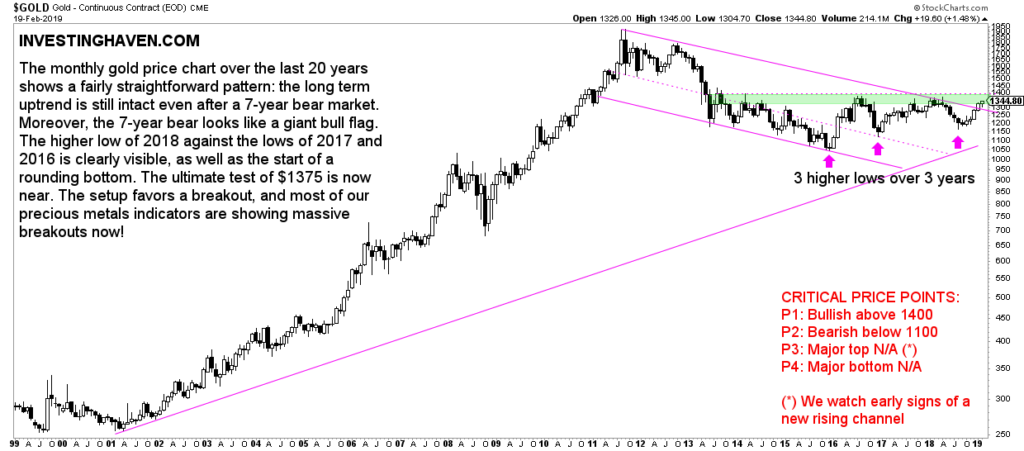
The monthly gold price chart has a gorgeous setup. Look at those 3 higher lows over the last 3 years. Also, look at the 3d touch of this green resistance bar. This is momentum building up, this is a proverbial pressure cooker.
By far the most important price point, as said many times in this article, is $1375. A break above $1375, and 5 consecutive days closing above it, ideally combined with 3 consecutive weekly closes above it, would confirm a giant brakout.
We expect this ‘event’ to take place any time soon! Yes, after almost 8 years, the precious metals market may turn bullish now. This is major news, and it goes under the radar.
The major media outlets do not help in our understanding on what really to make out of the price trend. MarketWatch suggests gold rising because of trade talks, Barron’s simply described the evolution of the gold price while Yahoo! Finance discussed some technicals. Bloomberg notices that large investors are increasingly getting bullish on gold. So what, is what most investors would ask?
Nowhere do we see any relevant point about a gold price forecast for 2019. InvestingHaven, however, has quality materials in this article forecasting what is about to happen in the gold market, and why!
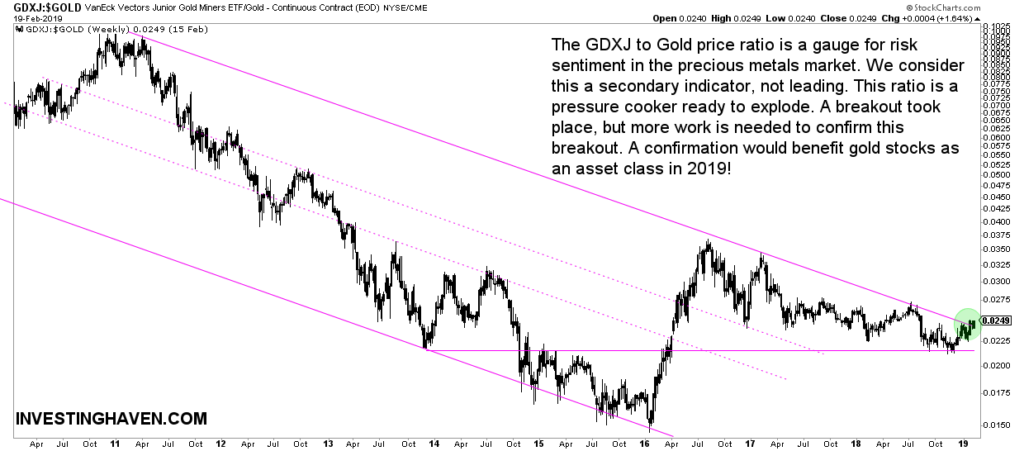
As said a couple of times in the past one of our favorite indicators in the gold markets is the junior gold miners index (GDXJ) to the price of gold. It is a ratio that tells something about risk sentiment in the precious metals market. It goes up when investors feel that they should take risk in gold assets. And it goes down when they do not like gold assets, and maybe only hedge their global market risk with the gold price (not the rest of the gold market)!
The junior gold miners to gold price ratio is in a falling channel since 2011. This makes sense of course as that’s when the precious metals bear market started.
However, a spectacular breakout is now in the making, after an 8-year bear market!
This breakout started a couple of months ago, but a small push higher is needed to confirm it.
We keep a very, very close eye on this ratio combined with the gold price chart shown above. Both combined willl determine a confirmation of gold’s giant breakout, and with that the whole precious metals market turning bullish!
** Update on March 2nd, 2019 **
Panic among gold investors after a gold price drop! Is our gold forecast still valid?
The gold price dropped to $1299 yesterday after peaking at $1350 on Feb 20th, 2019. That’s a $51 drop in 7 trading days, or just 3.7 pct.
Admittedly, this is a drop, but it’s not to the extent that this is concerning in any way. Still, several followers reached out to us, asking how concerned they should be.
The big problem we see is that investors have a very short term focus. They check price changes combined with the endless stream of financial and social media news. It creates a blurry view for investors if they are not able to apply a method in a disciplined way. They tend to focus their focus from longer term dominant trends to short term price changes.
Let’s look at some examples of today.
Marketwatch says in their headline that gold drops as U.S. GDP data come out better than expected. So what? As if there is a correlation between both. Gold investors may overreact if they take this too literally.
Similarly, Reuters says that gold is on its way for the worst week since May 2017. Again, so what? Does it mean there is more downside, and if so how much? Unclear!
And then here is our favorite topic, also by Reuters. Venezuela’s central bank is moving 8 tons of gold … so … Indeed, so what? Supply of physical gold really says nothing, absolutely nothing, on gold’s price.
We urge gold investors not to over react, and take a step back.
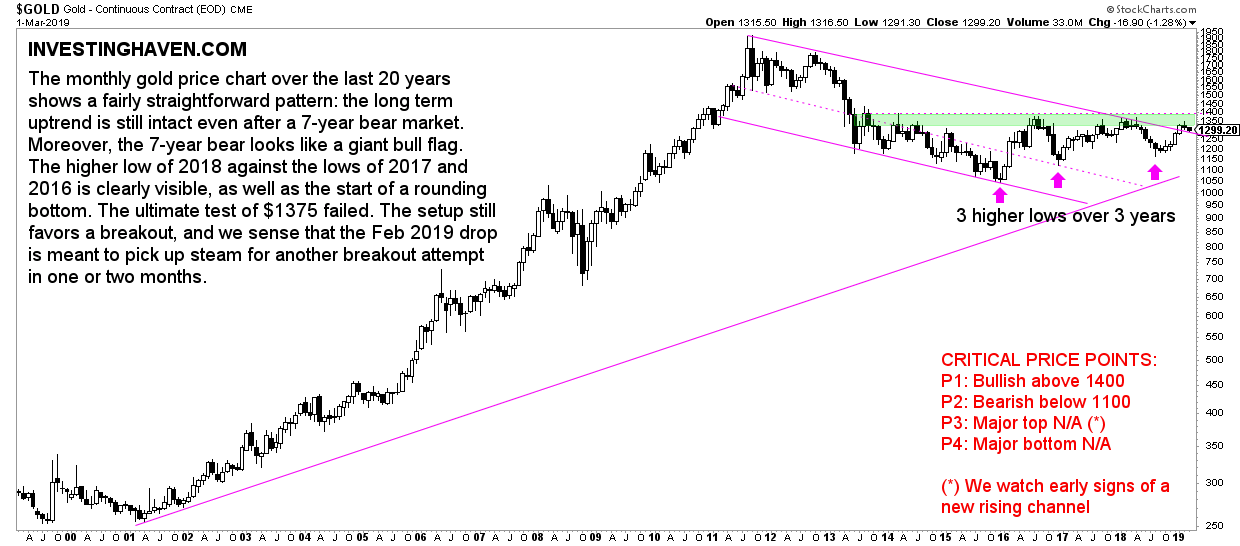
Our gold price chart on the monthly timeframe shows that gold failed to get back above the important $1375. Gold is now moving between this giant wall (green bar) which is the bear market wall. It is still trading ABOVE its falling support line.
Let’s give the gold market the time it needs to do its magic. We feel it’s coming, and there is a good reason why we tipped silver miner as a major candidate for one of the TOP 3 investing opportunities of 2019.
** Update on April 16th, 2019 **
Slight retracement in the price of gold: concern or not?
Fundamentally, nothing has changed in the gold market as its price retraced in recent weeks. The only thing that changed is intermarket influences primarily from interest rates and currencies as well as the technical picture in the futures market and on gold’s chart.
This is exactly 7 months, almost on the week, that we published the original version of our gold price forecast. In September last year we came up with the original gold price forecast article suggesting gold’s price would turn bullish at “a” certain point in 2019.
Based on our 3 leading indicators for the gold market we made our prediction that gold would test $1550. This assumes a break above the giant bear market well of $1375.
Retracement is no threat for our gold price forecast
We did revisit those 3 leading indicators, or ‘influencers’ of gold’s price, in the article above. Readers should scroll up and check out the first part of the article. We added an editorial note in the part of the 3 leading indicators with the editorial comments of April 16th.
Our conclusion:
All in all, conditions were not supportive for gold to break through its giant stubborn gold bear market wall at $1350. Note that this ‘wall’ is there for 6 years, it is very tough to destroy this with a breakout. Gold needs strongly favorable conditions for this to happen.
We believe the Euro will become more supportive for gold’s price. Similarly, the futures market will help gold’s price starting in the next few weeks or months.
As seen, we emphasized these points in the text above, particularly in the leading indicators section. Therefore, we recommend readers to check the up to date charts. It shows the evolution since we first published this gold price forecast 8 months ago.
Gold price chart
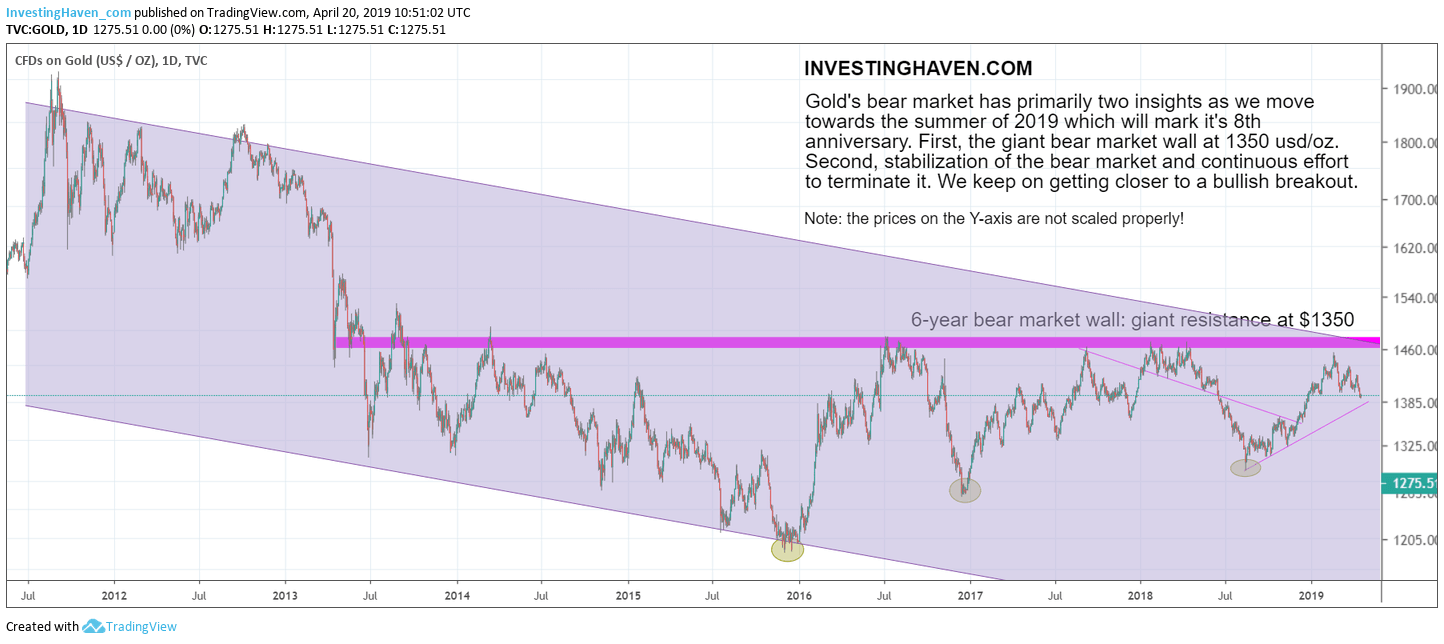
Moreover, gold’s chart is about to provide strong support, especially in the $1250 area. Below is a different version of the gold price chart than the one we mostly use for our gold price forecasts. It shows only the bear market that is about to celebrate it’s 8th anniversary later this year. This chart view makes the point how hard it is for gold to overcome this giant wall.
Early 2019 the conditions looked more in favor of gold. By April we see that they softened.
The way we do interpret this is that the gold market is collecting energy for its next push higher. It will try to pierce through this stubborn wall, it just needs lots of energy.
Maybe even more important thing to watch is the inflation support. This is supportive of gold’s price.
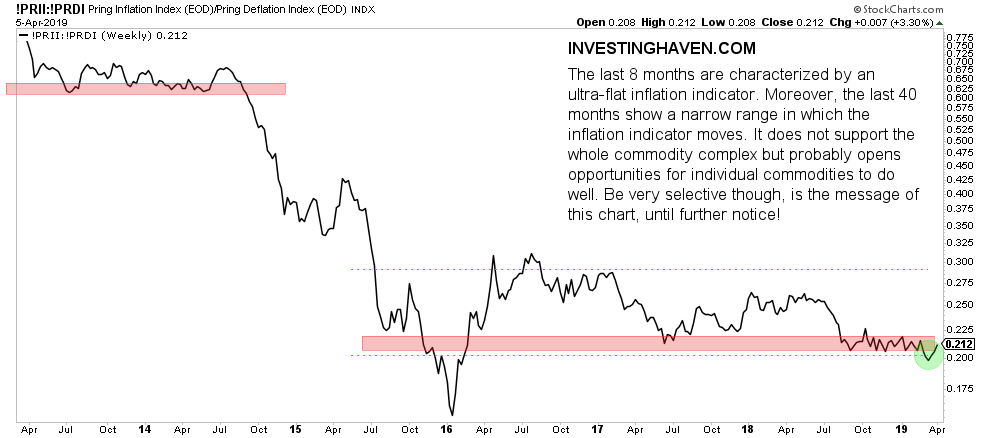
Inflation indicator supportive for our gold price forecast
Below is a chart we did not feature yet as it wasn’t that relevant so far in our gold price forecast.
However, it seems its importance is gaining traction now.
We see a significant double bottom. Moreover, important support did hold in the first months of 2019. According to us this inflation indicator is about to turn up again. The price of crude oil is bullish again, and has some 20 pct upside potential.
Several other commodities trade at at secular support, and they have serious upside potential. Rates are stabilizing after their early 2019 crash. All this is supportive of the inflation indicator which should be supportive for commodities as well as gold.
In sum, we see mid-April is that the retracement is not a big deal in the bigger scheme of things. On the contrary we believe the gold market is picking up steam to break through its giant resistance area $1350. Presumably this will happen in July / August of 2019.
[Ed. note: As of this week we will provide in-depth analysis to our ‘free newsletter’ subscribers. We will bring premium content with specific (gold and silver) investing tips on a weekly basis, mid-week, free of charge. We will do this for 4 to 6 months. Subscribe to our free newsletter and get premium (gold and silver) investing insights in 2019 for free. Sign up >> ]


