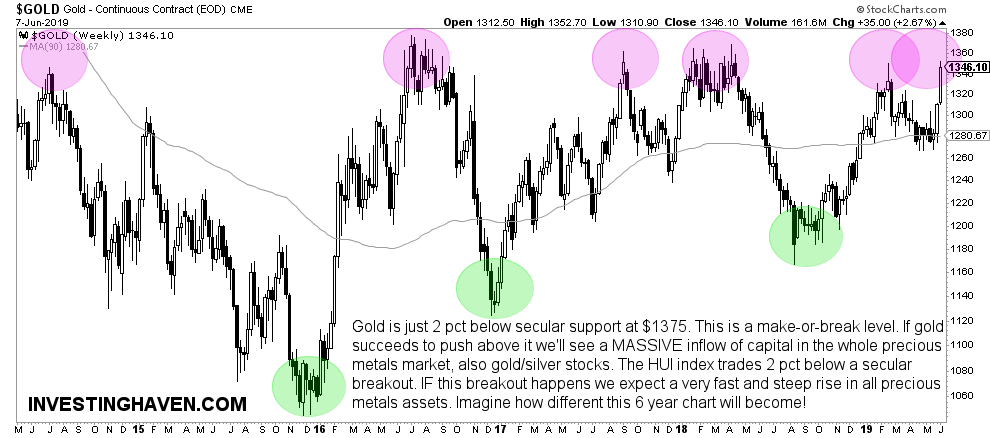
Gold’s moment of truth is here! Gold’s chance to shine is here! Will “it” happen or not in the gold market? To shine or not to shine? We will find really soon, as gold only needs a push of 2 pct to reach the top area of its 6-year giant bear market wall. In other words if gold (GOLD) succeeds to rise more than 2 pct, and stay above $1375 for 5 consecutive days and 3 consecutive weekly closes, we will have a secular breakout! This will push gold to our $1550 price target from our gold forecast written 10 months ago. Top gold stocks will do amazingly well. We will be extremely proud because our gold prediction which appeared on MarketWatch on May 3d will be accurate.
It really is 2 pct that gold has to rise, and anything higher as of that point will be in the ‘secular breakout’ space. That’s how important this is for gold, a turn in gold’s secular trend from an 8 year bear market to a new bull market.
It’s the type of event that changes a long bear market into a new bull market!
This is the 1% of the time you should pay very close attention to the gold market to get 99% of the potential profits out of it. This is what Tsaklanos his 1/99 Investing Principles stand for.
What will happen in that scenario?
- Gold will rise between 10 and 20 pct in a matter of weeks (maybe a few months).
- Silver will outperform gold as we believe silver will rise 50 pct in the same time period (see our silver forecast).
- Gold and silver stocks will rise between 25 and 100 pct in the same time period.
- Our top favorite silver stock will double, as explained in our A First Majestic Silver Stock Forecast for 2019
Sounds important enough to be on top of the gold market now?
We believe there is a very high probability gold will break out, either with the ongoing attempt (in the next few weeks) or right after summer (September to November timeframe).
Why?
Because the leading indicators explained in our gold forecast are supportive of higher gold prices. The Euro being the most important one is especially supportive with a potential tactical breakout, see The Most Important Chart For Global Markets Signals A Trend Change.
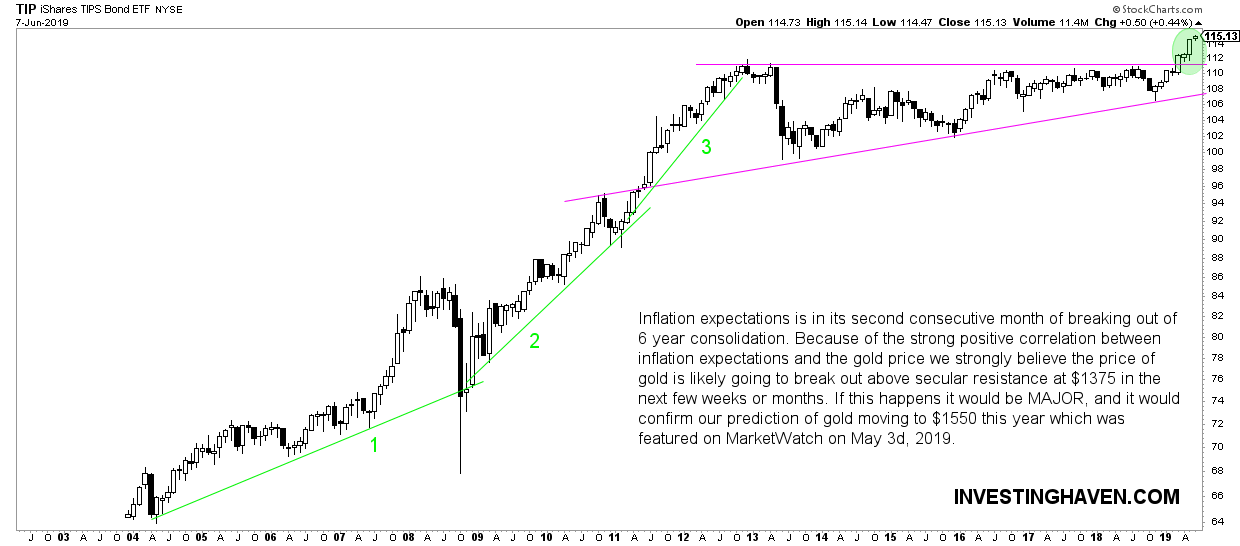
Moreover, inflation expectations confirmed a secular breakout last month. After they started their breakout in March, it was confirmed in May. Gold and inflation expectations are strongly (positively) correlated!
Gold’s chart does not indicate anything meaningful at this point in time. The weekly outlined below is one big yo-yo in the last 5 years.
However, once gold rises to $1375, and pushes slightly higher, the next weekly chart from gold will look *really* different.
The setup we see looks like a giant cup-and-handle which tends to have a bullish outcome.
We cannot wait to see gold rising to $1400 and look at the same chart below. It may happen the next days or months, or maybe we have to be more patient till next year, we will know soon!