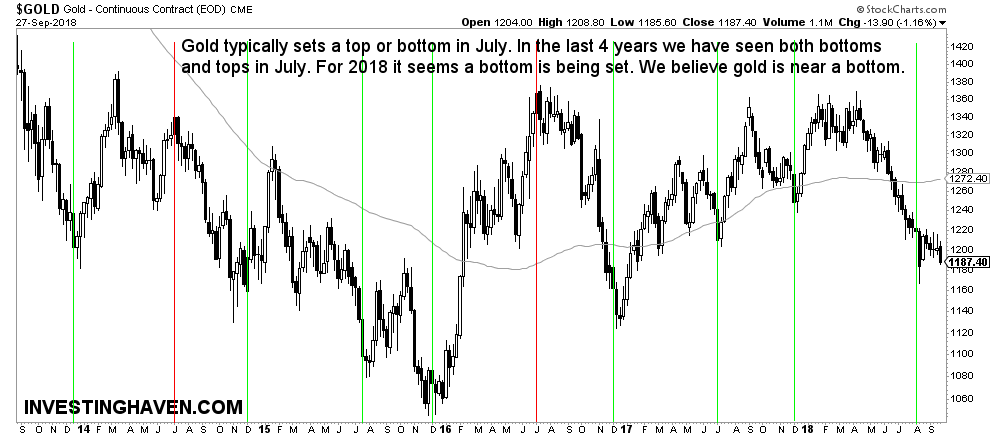
In our gold price forecast for 2019 we said that we saw the first signs of a rounding bottom pattern on gold’s chart. Is this still valid? Is our gold price target still intact?
As per our gold (GLD) price forecast the gold market has 2 leading indicators: the Euro chart structure as well as the COT evolution (trend). Both indicators did not change direction since we wrote our forecast, so from a leading indicator perspective there is no change to our price targets. This is what we wrote:
We tend to believe that the price of gold will go up to the $1300 area in 2019. Moreover, it is clear from this chart that gold is setting a range, and it will be an important point in 2019: the $1200 to $1375 range. Below $1200 is bearish, we can hardly believe gold will stay below $1200. Between $1200 and $1275 is more or less neutral. Above $1275 is mildly bullish. Above $1375 is wildly bullish.
As part of our gold price forecast for 2019 we saw gold setting a major cup-and-handle on its chart. It is the absolute condition for gold to go back up to the $1300 to $1375 area.
So the only question that investors should be focused on: is this rounding bottom playing out as expected on gold’s chart, knowing that the high level direction of the leading indicators is in favor of gold?
In other words, do not look for pointers in the news. As said many times gold news is a lagging indicator, not a leading indicator.
Below is the up to date gold chart. It clearly shows signs of the rounding bottom pattern. However, it also shows this vicious sell off this week which, so far, did not create any damage yet, but has to stop in order to avoid damage.
As said, there is a flipside: “Any failed attempt to stay above $1200 will be the bearish scenario, and it might gold to $1050, though the least likely in our opinion (less than 5% probability).”
Investors should never exclude the flipside of any story. Although the gold chart shows a rounding formation since May of this year, not seen in the last 5 years on below chart, it can always go the opposite direction in a sudden way. It is not a matter of being fearful all the time, but a matter of understanding when an assumed direction or pattern gets invalidated. For gold, we are close to invalidating the rounding bottom, so the next 2 to 3 weeks are crucial.


