The copper market is falling lately. It is a classic situation in which investors ask whether it is a buy opportunity or time to short copper? One thing investors often forget is that there is a 3d option: do nothing! As per our investing method and our leading indicator theory copper is neutral right now, and likely for a while! Note that this is fully in line with our Copper Price Forecast 2019 published at the end of last year!
Our mantra is this recurring warning to our followers not to read too much into the news.
As per Tsaklanos his 1/99 Investing Principles (which will become the subject of our first ebook to be released in 2020) it is just 1% of the news that has any relevance for investors. The remaining 99% is either great for storytelling or absolutely worthless for investors.
Likewise, this WSJ article on copper may have relevant and interesting insights from a fundamental perspective but it’s not relevant for copper’s price.
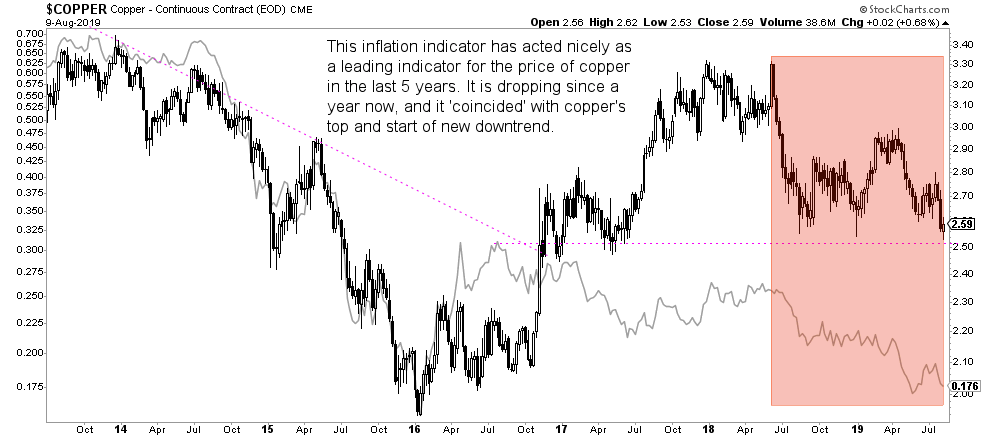
The leading indicator is not fundamentals, but inflation.
The first chart shows the strong correlation between the copper price and the inflation indicator. Note how both started dropping simultaneously somewhere a year ago!
The inflation indicator is hitting rock solid bottoms, so the downside in the copper price may be limited. Still this does not equal that it’s time to buy, on the contrary!
Don’t try to catch a falling knife!
Note the ongoing inflation may be different than the inflation expectations. The latter is strongly correlated with gold’s price, as said in great detail in Will Gold Benefit From The Giant Breakout Of Inflation Expectations In 2019 as well as in Major Disconnect Between Inflation Indicator and Inflation Expectations.
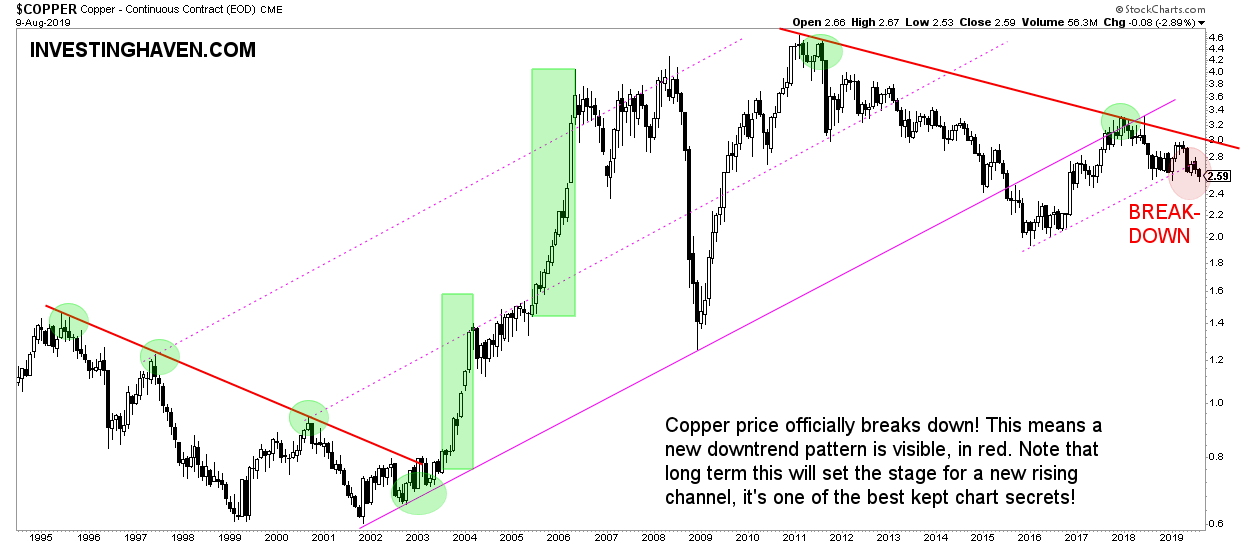
The more interesting insight comes from copper’s long term chart. This shows the secular trend(s).
Note how copper’s testing of its bear market trend line last year was the peak. It’s the same price point as the one indicated on the above chart when the inflation indicator peaked as well.
What a different perspective this long term chart provides when compared to the one above!
What we see is a similar situation as in the 90ies. A bear market resistance line, both indicated in red.
Note something ultra important: the falling structure, especially the peaks, did set the stage for the subsequent rising channel that started many years later!
Yes, these are the chart secrets that nobody talks about, but you only find on InvestingHaven.com! That’s why we recommend you sign up for our free newsletter which is all about chart secrets, for free for another 4 months.
[Ed. note: As of this week we will provide in-depth analysis to our ‘free newsletter’ subscribers. We will bring premium content with specific investing tips on a weekly basis, mid-week, free of charge. We will do this for 4 months. Subscribe to our free newsletter and get premium investing insights in 2019 for free.]