It was a very devastating week for silver investors. It is one week ago that we wrote Silver’s Spectacular Long Term Chart That Many Silver Investors Forgot To Check. Only a few days later silver looks certainly less spectacular, and the violation of a critical horizontal support level created a domino effect. We did not hold silver positions in our short term portfolio nor any precious metals miners in our medium term portfolio because the setup was promising but did not deliver confirmed buy signals. Let’s review how silver is doing as it relates to our long term silver forecast.
Before looking at the silver charts we want to stress the high level of accuracy of our writing last week. This is what we said (quote):
It is pretty simple in the case of silver. Look at the solid red horizontal trend line around 26 USD. We have one month of price action above it. As long as silver remains above this level we know it is consolidating and preparing a move higher (not lower).
In other words we did clearly indicate the ‘line in the sand’ level, and that’s meant to protect investors. We don’t make those poinsts for fur, we make them because they are critical.
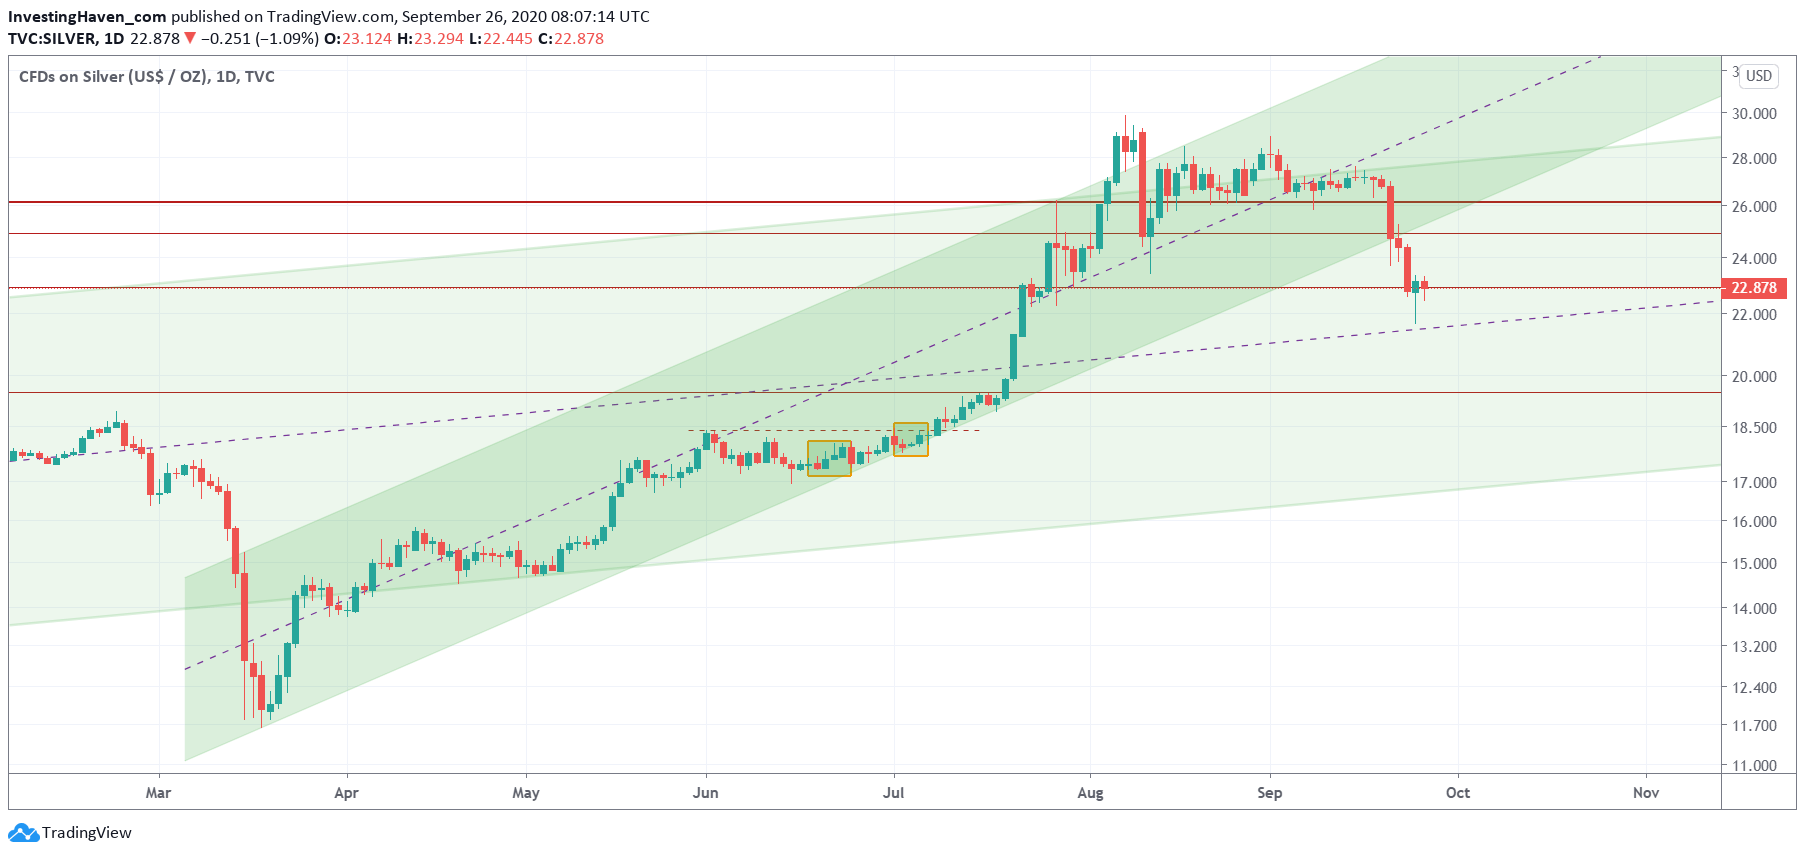
The daily silver chart shows how that important ‘line in the sand’ level of 26 USD was the level that, once hit, accelerated the move lower.
Silver is now at the last support level before a major gap to the lowest support level (19 USD). The median line (dotted line) can and should help provide support. But this current level better holds, otherwise we’ll see another 10 pct down day. Not saying it will happen, just making a conditional statement here!
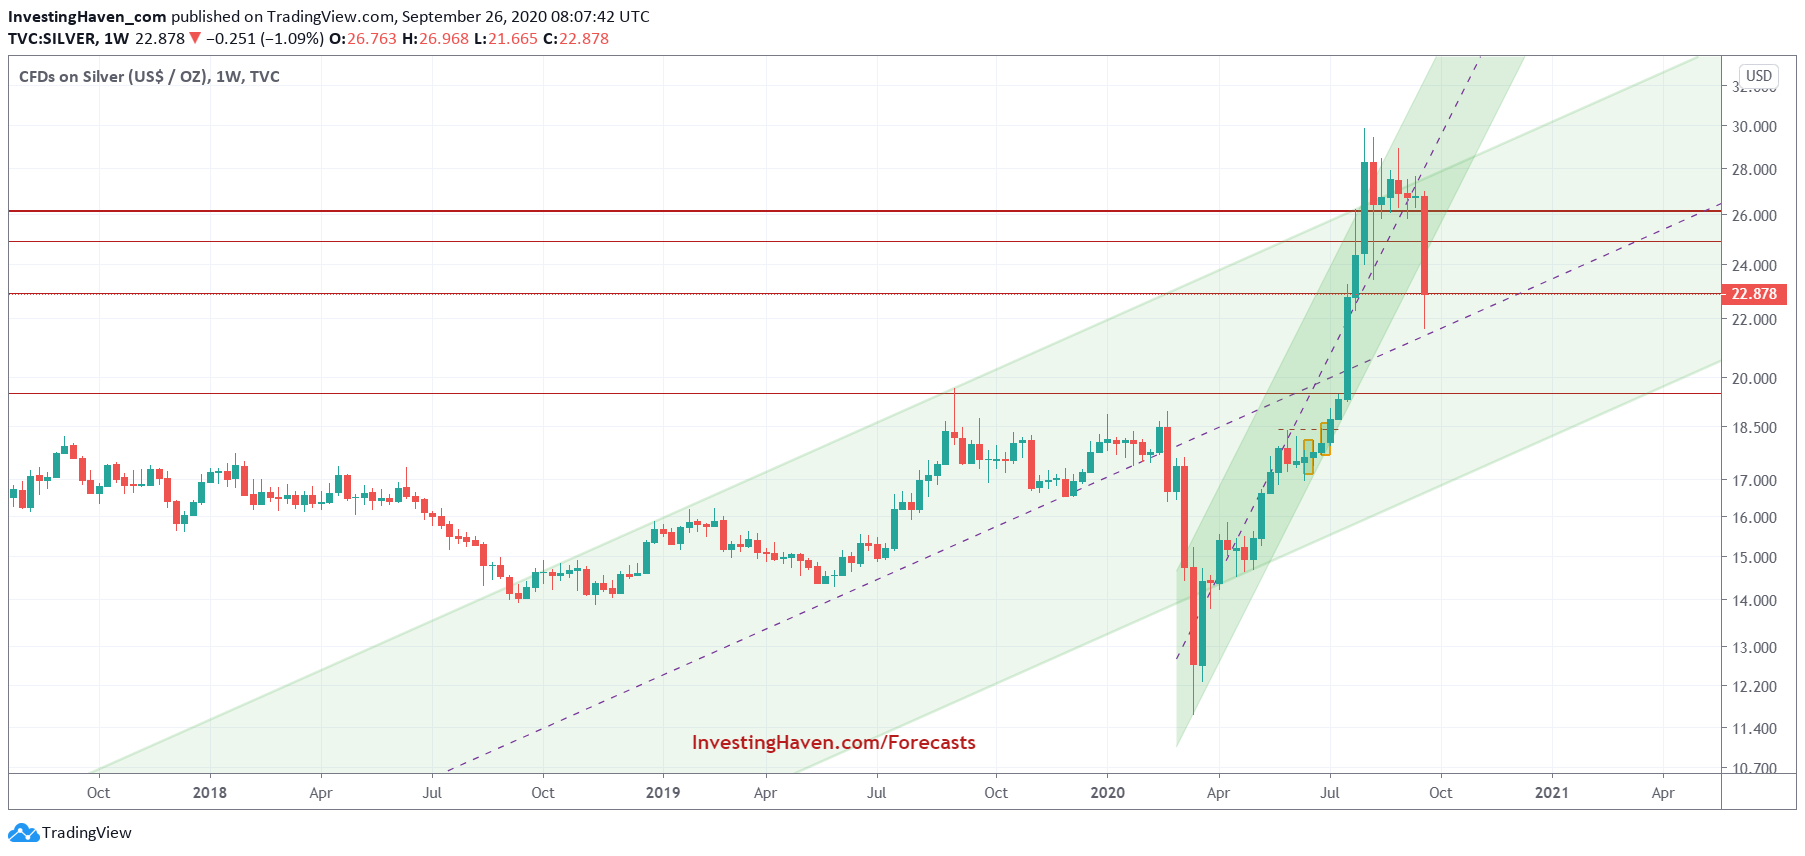
The weekly shows how ugly last week’s decline was.
Again, that important 26 USD level is the one, once violated, that could not prevent silver from falling in one straight line down.
Here as well we see the median line and the 22.5 USD levels provide support. But this better holds.
The monthly still is spectacular, but not as spectacular as last week.
Long term uptrend, is what this chart says. Same conclusion when it comes to the 22.5 USD support level: it better holds.
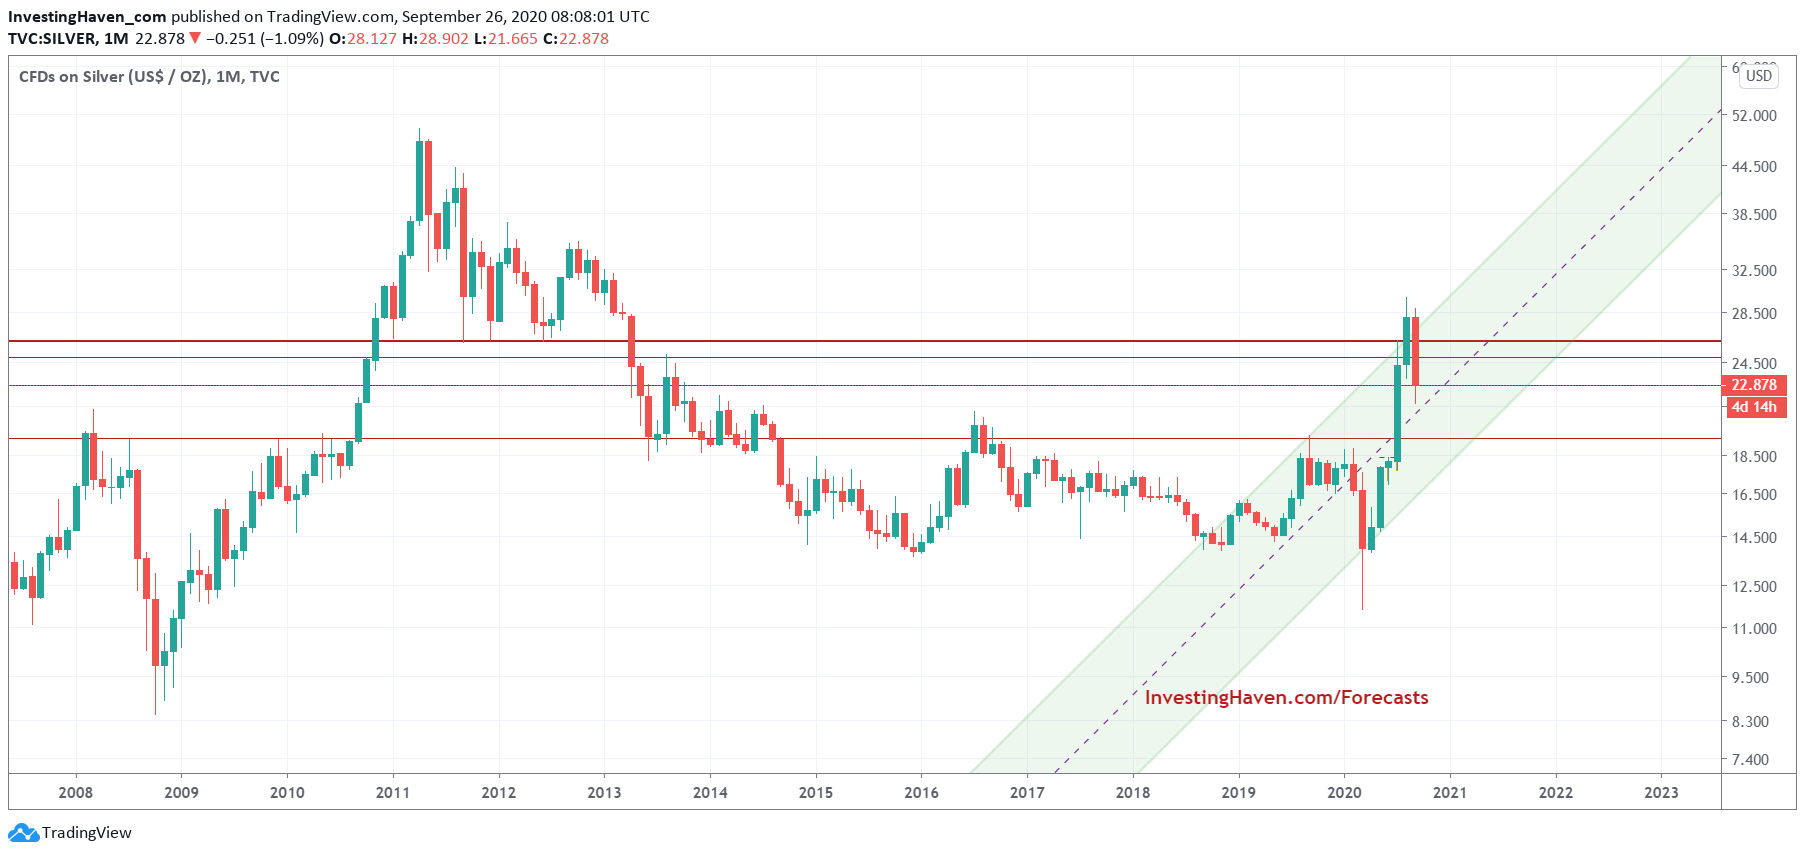
No entry point as of yet, we should monitor these silver charts closely until we see a bullish reversal come up.
Last but not least, the silver futures market positions.
This one is significantly improving. Open interest has declined significantly. The levels of commercials is still high, but the decline of this week is partially reflected in the data. We expect this setup to improve in the next few weeks, it’s probably the one chart that makes us want to keep tracking silver closely.
This last chart combined with the support level 22.50 USD we know exactly what we have to look for to understand when silver will give us an enticing buy opportunity!
Within our Momentum Investing portfolio we keep a very close eye on the gold and silver market, particuarly we look at miners. As a trader we saw an opportunity, and initiated a position in the gold market with a tight stop loss in our Trade Alerts portfolio. Note that our recent precious metals trade performed really well: a short term SLV position delivered some 15 pct in Trade Alerts, and our short/medium term silver miner investment delivered some 20 pct in Momentum Investing. Also, our recent GLD position was stopped out with a perfectly chosen stop loss, avoiding the bigger beating that most gold traders had to take in the week of Sept 21st, 2020.


