For a while now, the price of silver was setting up for an explosive move to the upside. There were multiple macro level indicators and chart setups pointing towards an explosive breakout. The detailed analysis was laid out in our annual silver price forecast back in November 2021. Fast forward to spring 2022 and we still haven’t seen that move materialize.
What’s happening with silver price in 2022? Is the choppy action here to stay? Is the price currently breaking down? These are the questions we will try to answer. Zooming into the relatively smaller time frames but keeping in mind the bigger picture.
Silver Price Bullish setup into 2022
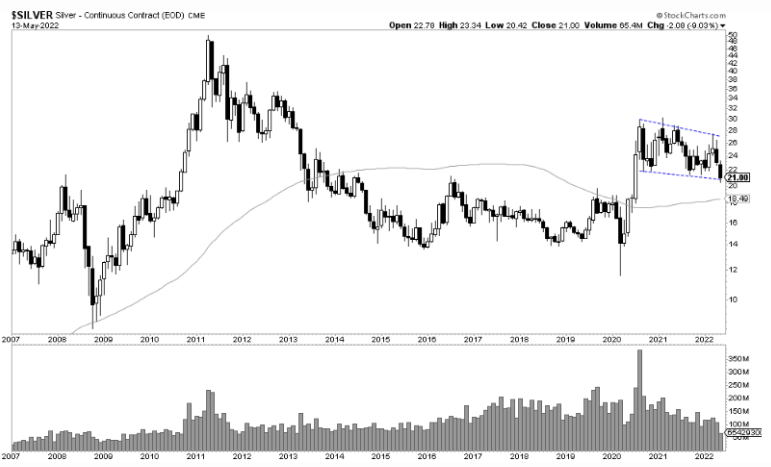
Looking into Silver price’s monthly chart, we see the following: a clear well defined bull flag, a continuation pattern that could easily take the price to 40 USD if the move materializes.
The close of the month of May is important so the Bullish structure remains intact.
Since mid 2020, Silver price was setting up for its next big move. It could go either way but as long as the pattern doesn’t break, we are still likely to see a fast move to the upside. A clear Bullish pattern has been setting up for almost 2 years now and would usually lead to a powerful move.
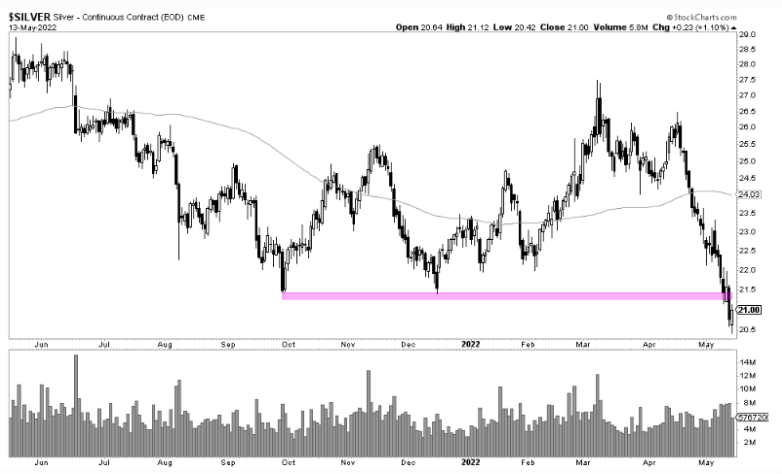
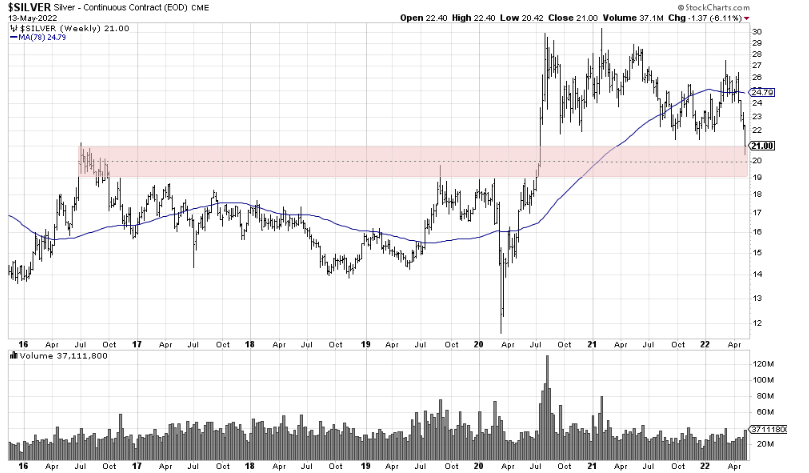
On the daily chart however, we can see that the volatility isn’t over yet and that the price just made a lower low. So we would expect more choppiness for the weeks to come.
Back to our forecast, where we mentioned the following:
We expect silver to create a bull run when the Euro starts rising on falling bond yields. This will come after a period of rising bond yields. That’s also a good setup for a weak stock environment: after a rise in bond yields and accordingly rising stock prices in 2022 we expect both to retrace. IF this happens on a rising Euro it would create the perfect environment for silver to start a bull run.
So what happened?
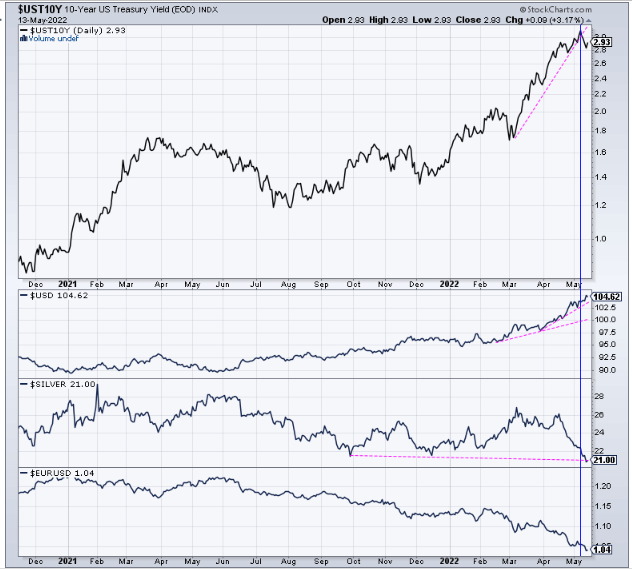
Historically, one of our leading indicators, the Euro, is positively correlated to precious metals whereas bond yields have a negative correlation to both Precious metals and the Euro. As silver price breaks down on the daily in May, we also note an anomaly in the intermarket dynamics: We have falling yields, falling Euro, falling precious metals and the USD is pushing higher.
Something has to give and you can see below how the USD move is starting to look overextended, Yields already started pulling back and looking toppy, the Euro needs an article on its own and Silver is close to support.
Intriguing price action to say the least, but when we zoom out, we can see (again) that the price is still supported and that we are seeing a ‘back test’ of previous breakout levels. As long as the below area holds, our bullish forecast continues to be valid. Should these levels break, we will have to reassess.
Not mentioned in this article, but one other leading indicator of silver (the futures markets CoT report) is now turning wildly bullish. No overstatement, truly wildly bullish. It’s not a timing indicator, it’s a stretch indicator. Members from our premium services Momentum Investing and Trade Alerts receive the commentary in the weekend analysis.
Written by hdcharting, reviewed by Taki Tsaklanos


