The Euro chart has lots of information … for those who are able to get it out of its chart. If anything, the Euro helps us understand momentum in stock markets (as it’s a risk sentiment barometer) but also gives us a good understanding about momentum in commodities. At this very point in time the Euro chart tells us that we have to be a little more patient if we are (will be) invested in commodities.
The daily Euro chart has a clear message: it wants to consolidate for 4 more weeks.
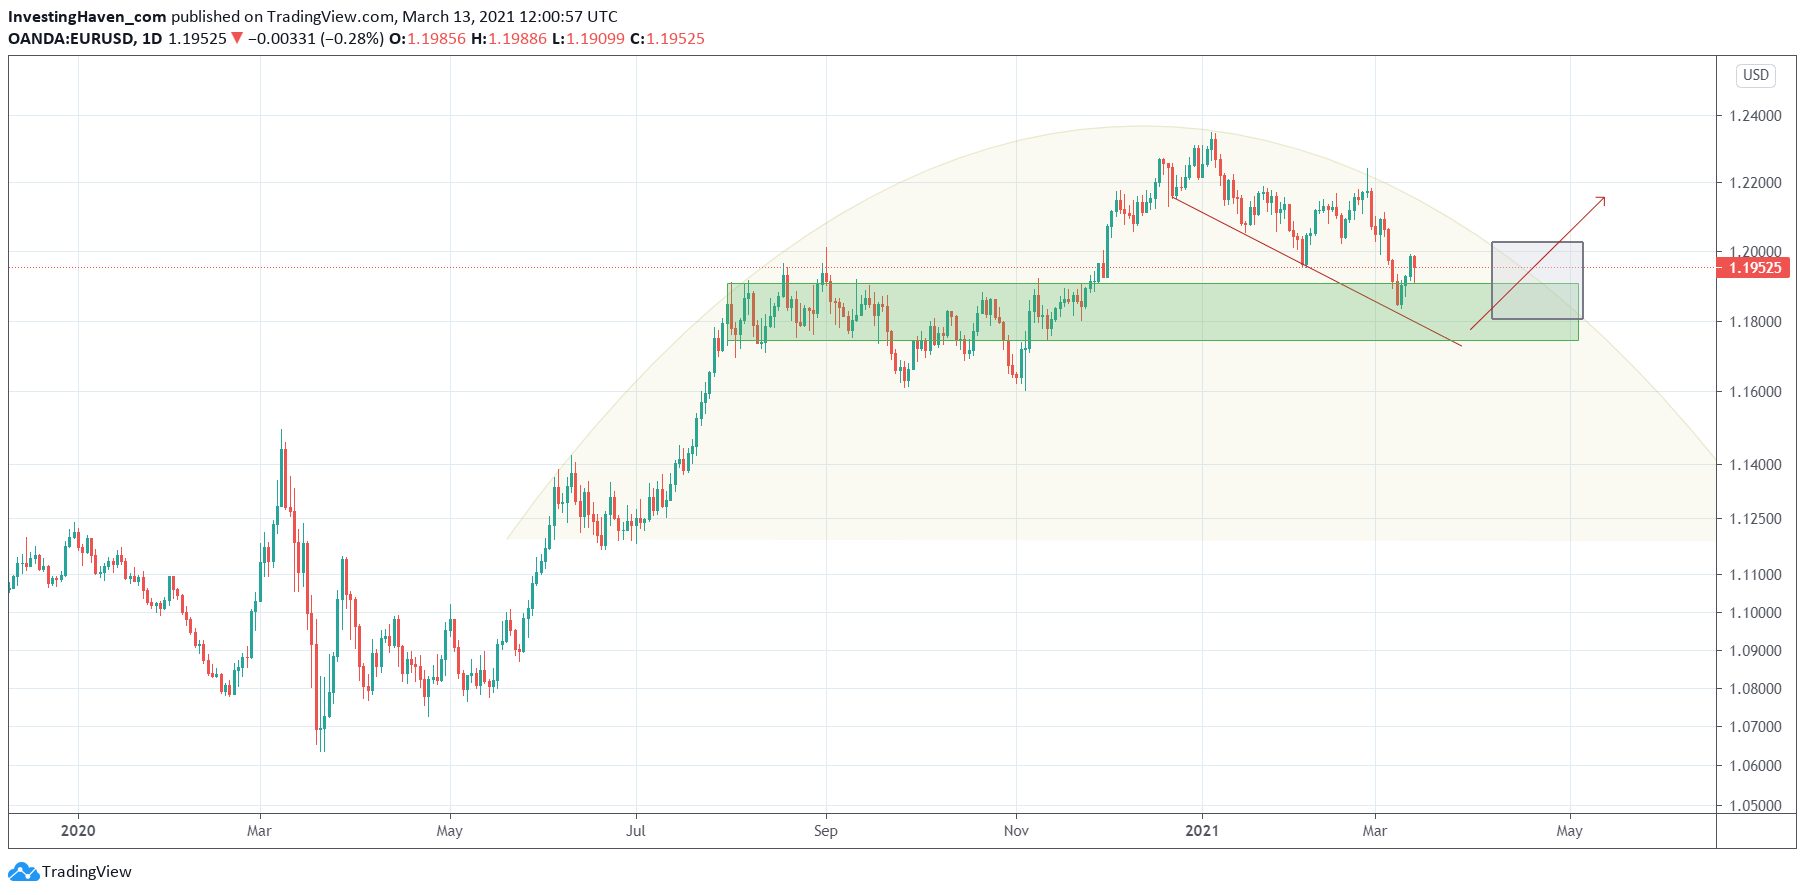
At this point in time the dominant pattern is a topping pattern. The yellow rounded pattern on below chart is the one we watch closely, and the grey area will be the resolution time window.
Moreover, the green area is an area which will provide lots of support.
So our best guess, reading this chart, is that the Euro will hold the 1.18 level and will resolve higher around mid-April. That’s also what we get out of the AUD chart, another barometer for commodities.
Investors in commodities have to be a little more patient, and have to watch closely which segments will start showing strength between now and mid-April. That’s how we prepare another position for our Momentum Investing members.