Gold has two more days to invalidate a breakdown. It’s looking ugly right now, the gold chart is really weak. At the same time we can imagine that gold is looking for a longer term bottom which it can use to start a slow yet powerful (bullish) reversal. We believe the time has not come for gold yet, and this is fully in line with our gold forecast 2021. Silver might outperform gold, but whether it will cross its breakout level at 28 USD is questionable. Silver above 30 USD already now, even we said in our silver forecast 2021 that it would happen later in the year? It depends on gold’s breakdown, or its invalidation. This is why.
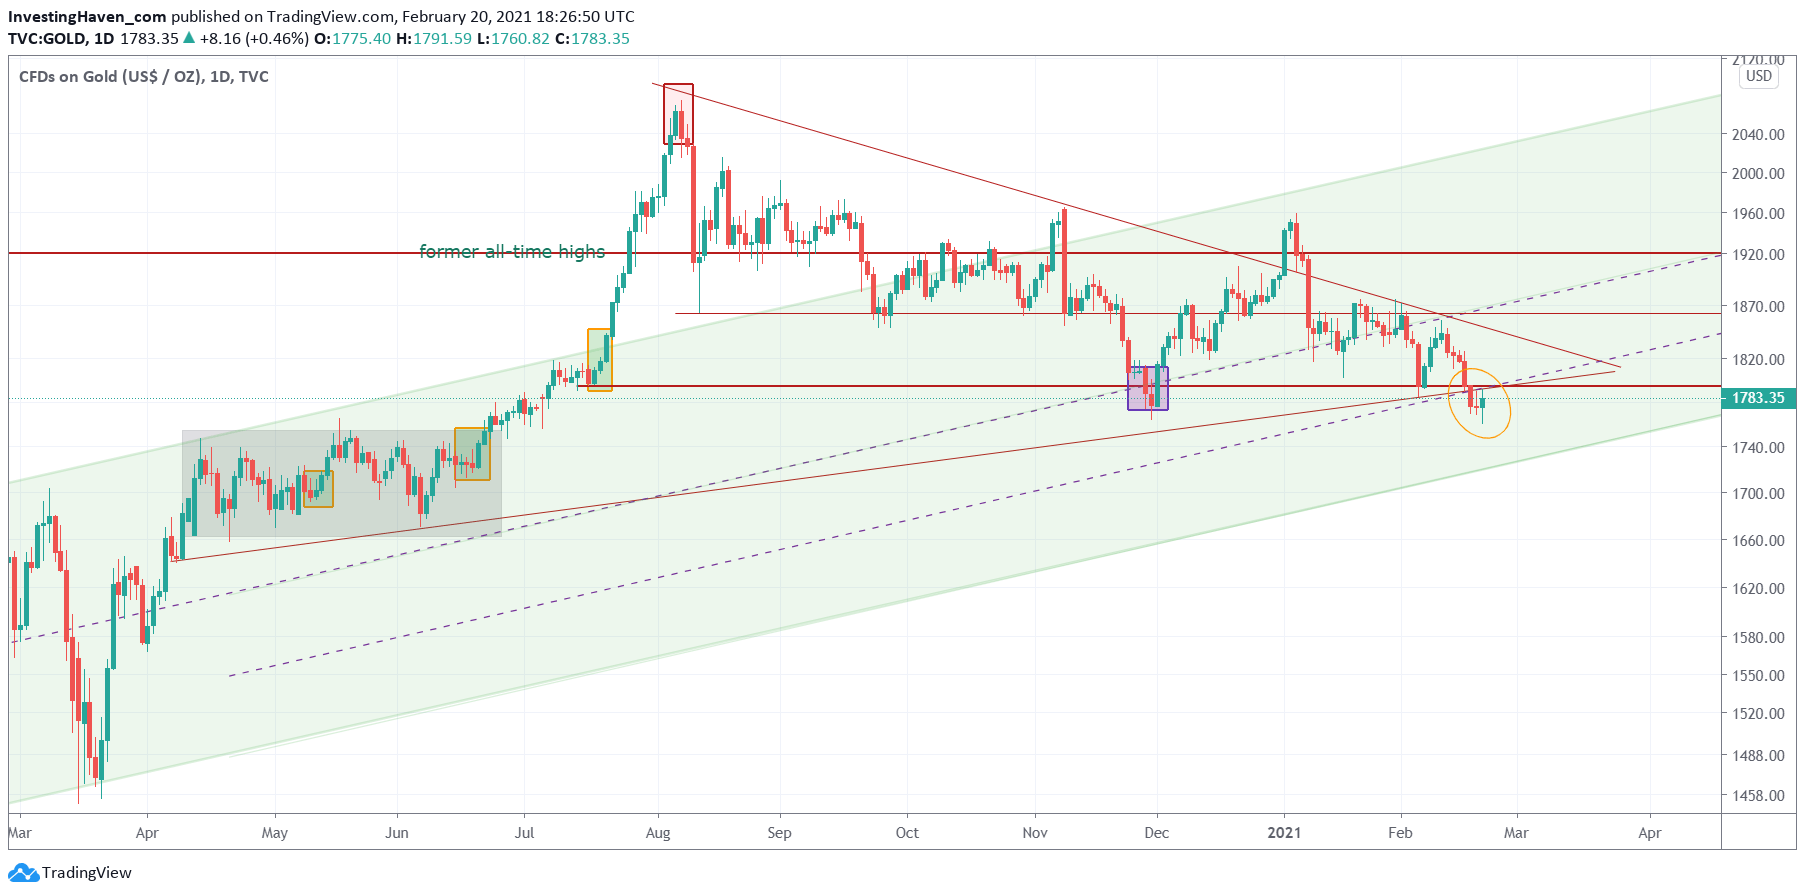
First, the gold chart on the daily timeframe.
It’s ugly, really ugly right now. Gold is now for 3 days below two key trendlines: the horizontal trendline which marked the start of the acceleration period in July of last year + the rising trendline which marked the start of the bull run in April of last year.
Not good, at all in fact.
Gold can invalidate this breakdown, and it will have to do so in the next few days. As soon as gold has full bodies of its daily candles above 1800 USD it will invalidate its breakdown. Until then, it’s a breakdown.
The reason for gold’s weakness is to be found in the credit market(s).
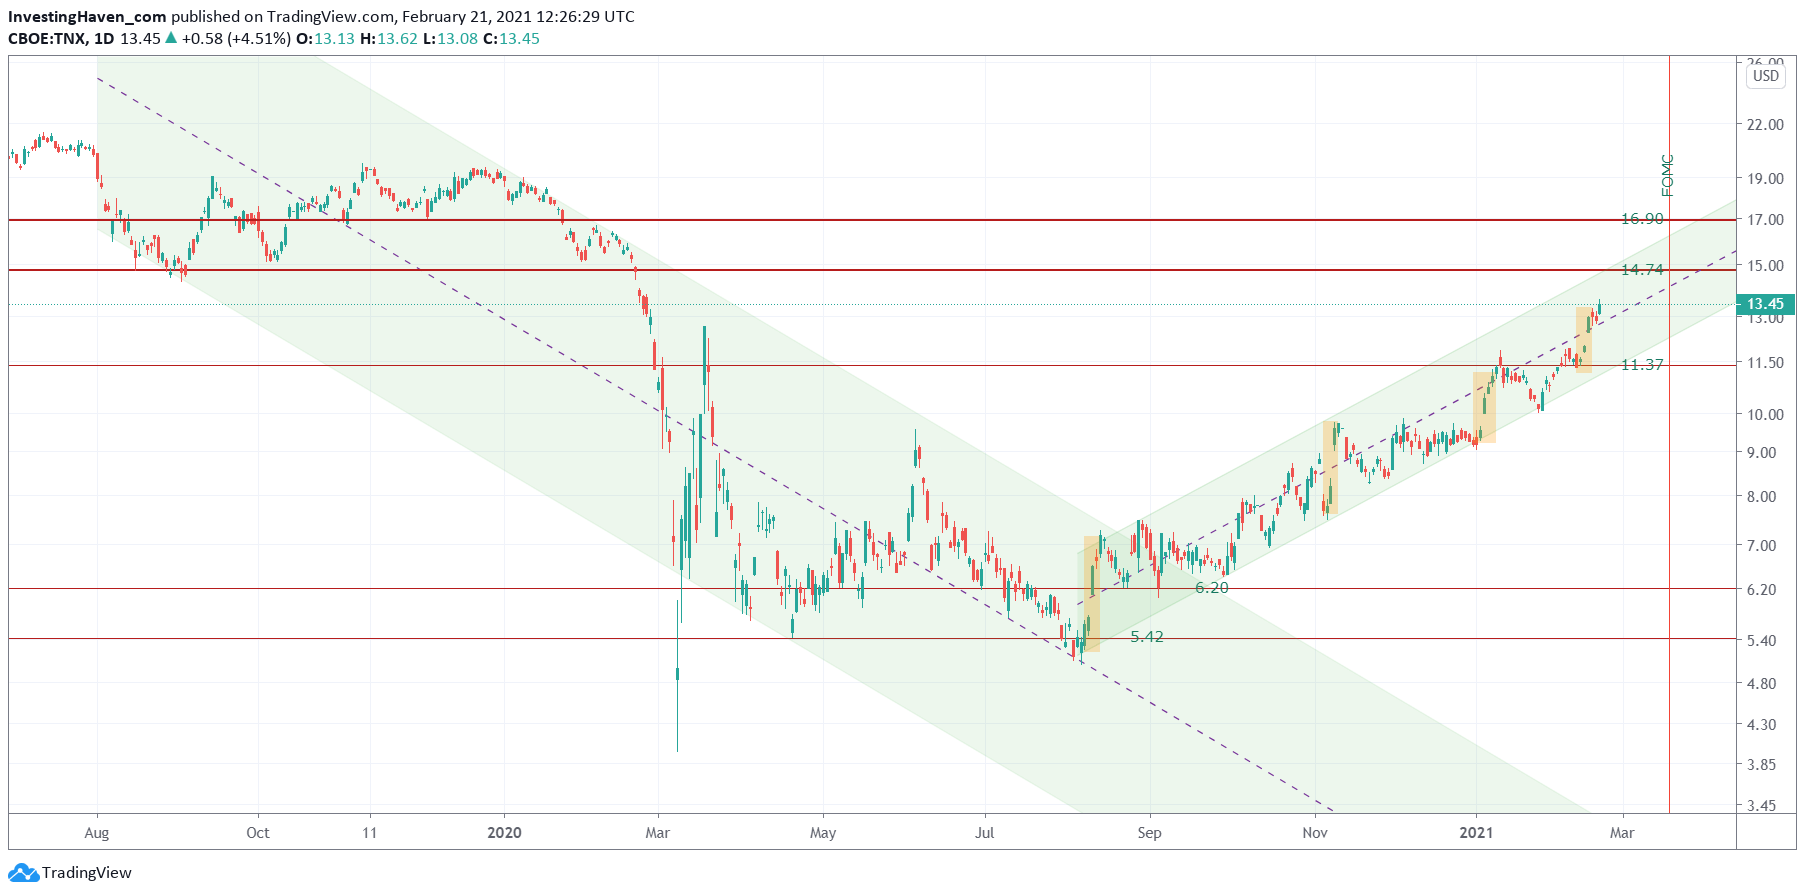
TNX, 10 year Treasury yields, are on the rise. And what a powerful trend it is on its daily chart.
Notice the trend change, and the start of the rising channel, in October of last year. Surprise surprise, it was a few weeks before the Corona vaccination was announced to the world which sparked an uber-bullish run in stock markets.
That’s why we keep on saying that TNX is a leading indicator, as it is able to signal a good or bad outcome for risk assets BEFORE it happens.
That said, rising bond yields is bad for gold. And a weak gold market is not exactly stimulating silver, even though silver can have tailwinds from its base metals side.
TNX is set to rise to 14.74, and ultimately 16.00, in the short term. Gold will continue to suffer until TNX is done rising. Gold can become bullish once TNX calms down. That will be the moment when stocks are likely going to take a break, and our Leading Global Stock Indicator will start a healthy retracement.
Enjoying our work? We feature more detailed analysis in our weekend updates of our Momentum Investing service. We also share which stocks we invest in, obviously in line with our higher level market readings. In our Trade Alerts premium service we focus on SPX trading with short term trades, and take a gold or silver position from time to time.