Crypto is rather flat for more than a month now. The big swings which characterize crypto markets disappeared and we wrote about this recently in Ethereum’s Volatility Is Disappearing. What Does This Suggest. What it ended up suggesting, in the case of Ethereum, is pre-momentum building. Ethereum resolved higher, for now, and our crypto auto-traders group got a buy signal on Tuesday morning (an Ethereum position was automatically opened for auto-traders). Is BTC also in a pre-momentum phase?
In our premium research service we tend to work with several advanced charts. To illustrate this, for BTC, we have 6 distinct charts with completely different structures. We have noticed, over time, that one or two of those 6 BTC charts tend to be dominant.
In this short blog post, however, we will work with the most basic chart, without annotations.
Before doing so, we want to highlight two quotes from our recent Ethereum article.
In the meantime, we see the ETHUSD chart flattening. IF (and that’s a big IF) the USD is setting a turning point it should support cryptocurrencies. That’s because both markets are inversely correlated. In that scenario we see a double or triple bottom type setup unfolding on the ETHUSD chart.
And this is the 2nd quote:
Here are 2 trends that might influence ETH this summer: a Nasdaq bounce and EUR bounce. IF (again, a big IF) the Nasdaq and the EUR will bounce from here, we expect a bounce in crypto which should create the center let leg of what could eventually become a W reversal. The 1700 to 2200 area should be a reasonable target.
Highly accurate, even in the public domain posts.
Let’s turn our attention to BTC now.
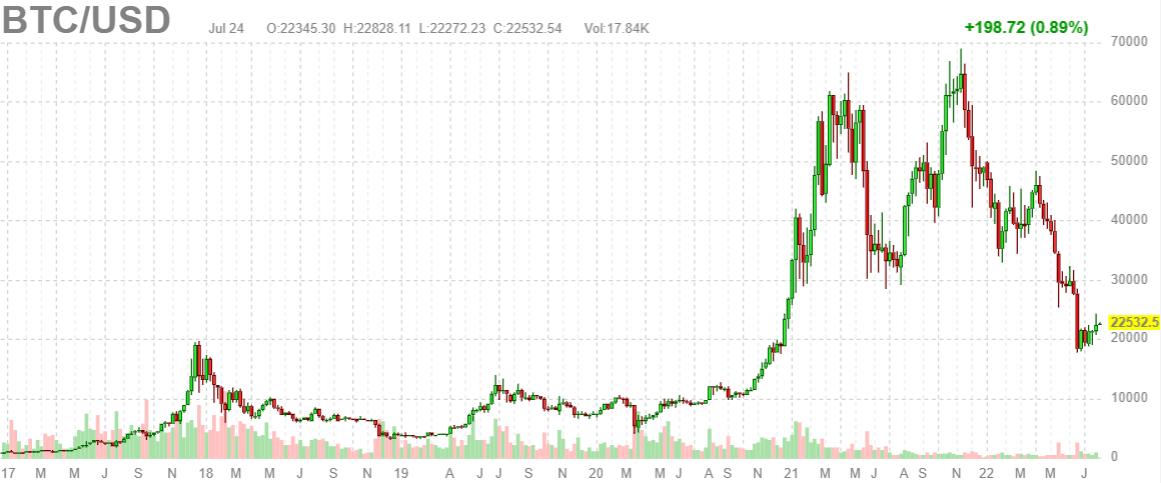
First, the weekly BTCUSD chart, not logarithmically optimized, is now for 6 full weeks in the lower 20ies. This week’s candle is shaping up as pretty important in the context of this recent structure. Why? Because you can clearly see the tendency of BTC to rise (you don’t need charts to notice this) but here is the key point: IF (that’s a big IF) Bitcoin succeeds in clear 23.7k, by next week Sunday’s closing, it will create a really bullish reversal structure, on the weekly (!) chart.
We need to wait until next Sunday night to know, but here is clearly hope for the bulls and a strong case to be made for a summer rally. Note that in our premium research service we work with much more detailed price points and couple this with points in time, a combination that hardly anyone else is able to apply.
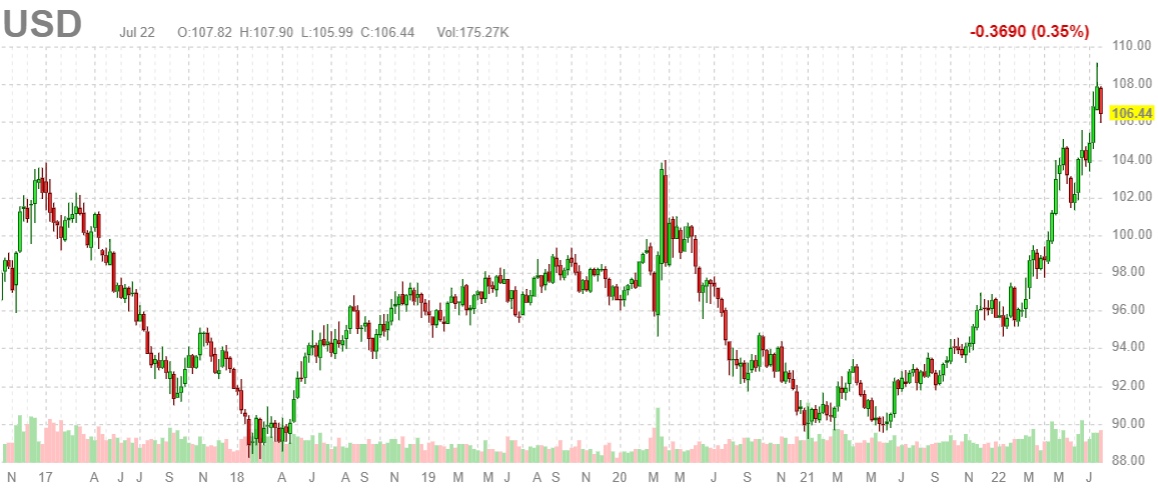
If we ‘flip the view’ and look at the leading indicator for markets and crypto (the USD, inversely correlated to markets and crypto) we see a really nice topping pattern characterized by last week’s ‘wick’. Admittedly, the USD has two more ‘wicks’ in recent months, on its weekly, but the last one is clearly the strongest week and indicative of a rejection to move higher. This is good for markets and crypto, let’s be very clear!
We can reasonably expect the USD to attempt to attack last week’s highs, but this is the exact price point to consider coming week in terms of closing price(s): 107.7 points.
We sent much more detailed updates to our Momentum Investing members with much more evidence why the USD topped, the day before its recent top which, for now, appeared to be extremely accurate. Our premium crypto members received similar insights, although a condensed version of it!