The recent crypto sell-off sent many cryptocurrencies crashing. Not so with Ripple, on the contrary even. Ripple continues to trade within its triangle pattern. As per our Ripple price forecast for 2019 we remain firm believers that Ripple’s XRP (XRP) token will be among the outperformers. The recent sell-off did not change this forecast, on the contrary, it reinforced this prediction. Similarly, not any of our 5 must-read cryptocurrency predictions for 2019 was impacted.
This article is not about fundamentals nor is it about relative strength in the crypto market. We focus on the impact of this week’s sell-off only on Ripple.
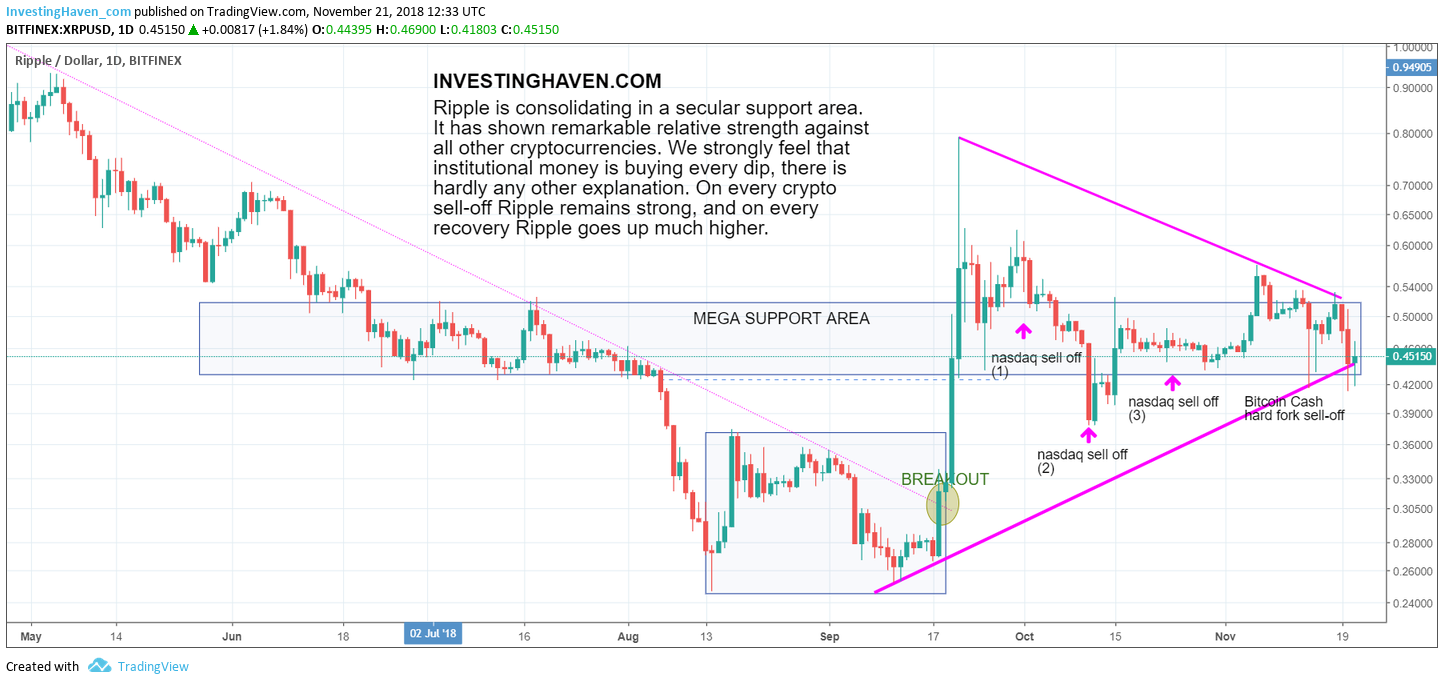
With the recent sell-off in cryptocurrencies it is interesting to note how Ripple respected its trading pattern. Particularly, this triangle pattern that started with the September lows and the giant breakout end of September is in play now.
Presumably, this pattern will resolve sooner rather than later, for sure before the end of this year but likely in the next 2 to 3 weeks (if not earlier).
Whether it will be an upside breakout or breakdown is tough to tell as a lot will depend on what Bitcoin does. As explained in great detail to our premium crypto subscribers last night the $4500 level in Bitcoin is quite crucial and might be a game changer.
How to play the next trend in Ripple? Pretty easy, as both the breakout and breakdown levels are clear, so anyone can take a position once “it” happens. Note, though, that the rule of 3 has to be respected: you need at a minimum 3 consecutive days of trading above or below a level to get a confirmation. This, as well, is explained in great detail in our blockchain & crypto investing research service >>
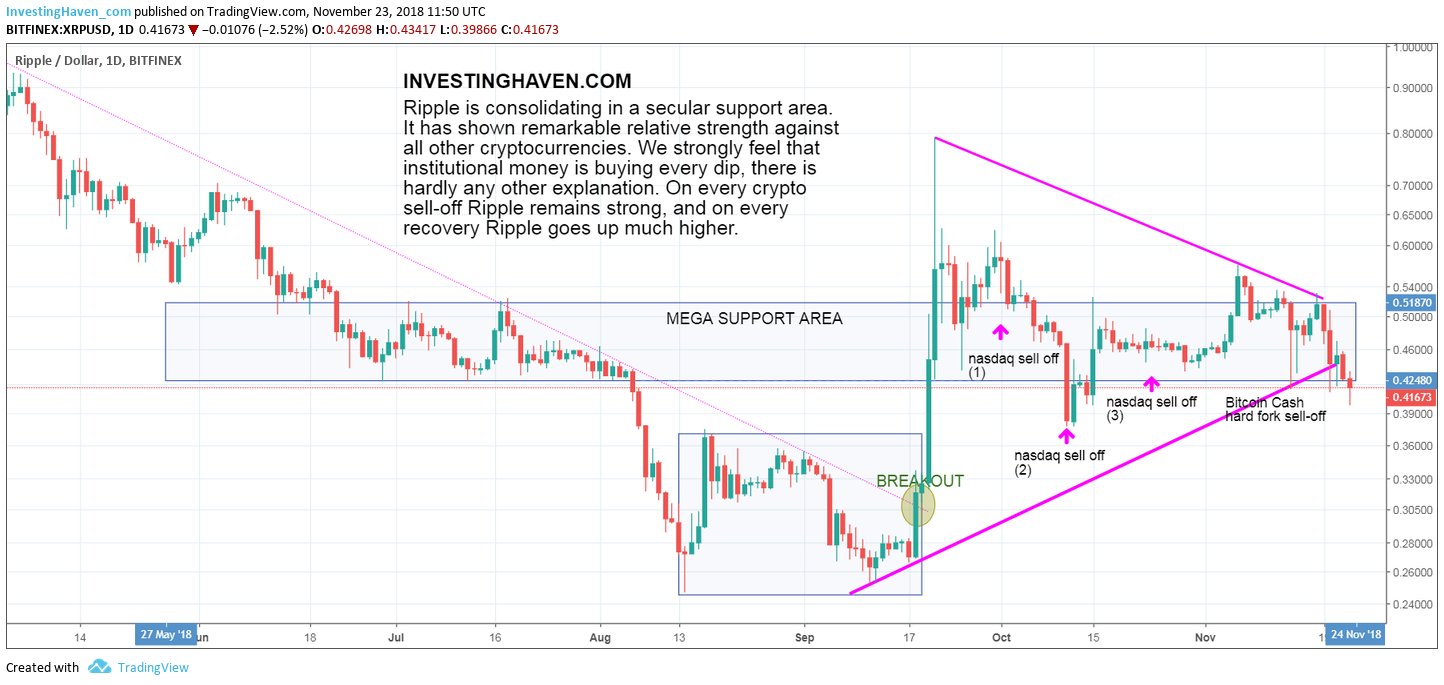
Update on 23 November 2018
The mini sell-off from last night sent Ripple’s price lower. As seen on the up-to-date chart on 23 November 2018 at noon GMT the triangle pattern is violated but the horizontal support is respected for now.
As always, there are many failed breakout and failed breakdowns on Ripple’s chart. So we need this confirmation of 3 consecutive closes to know for sure that the triangle pattern resulted in a breakdown.
However, we will also find out soon whether the horizontal support will be the dominant pattern.
Stay tuned, and we will update this article over the weekend if any change materializes.
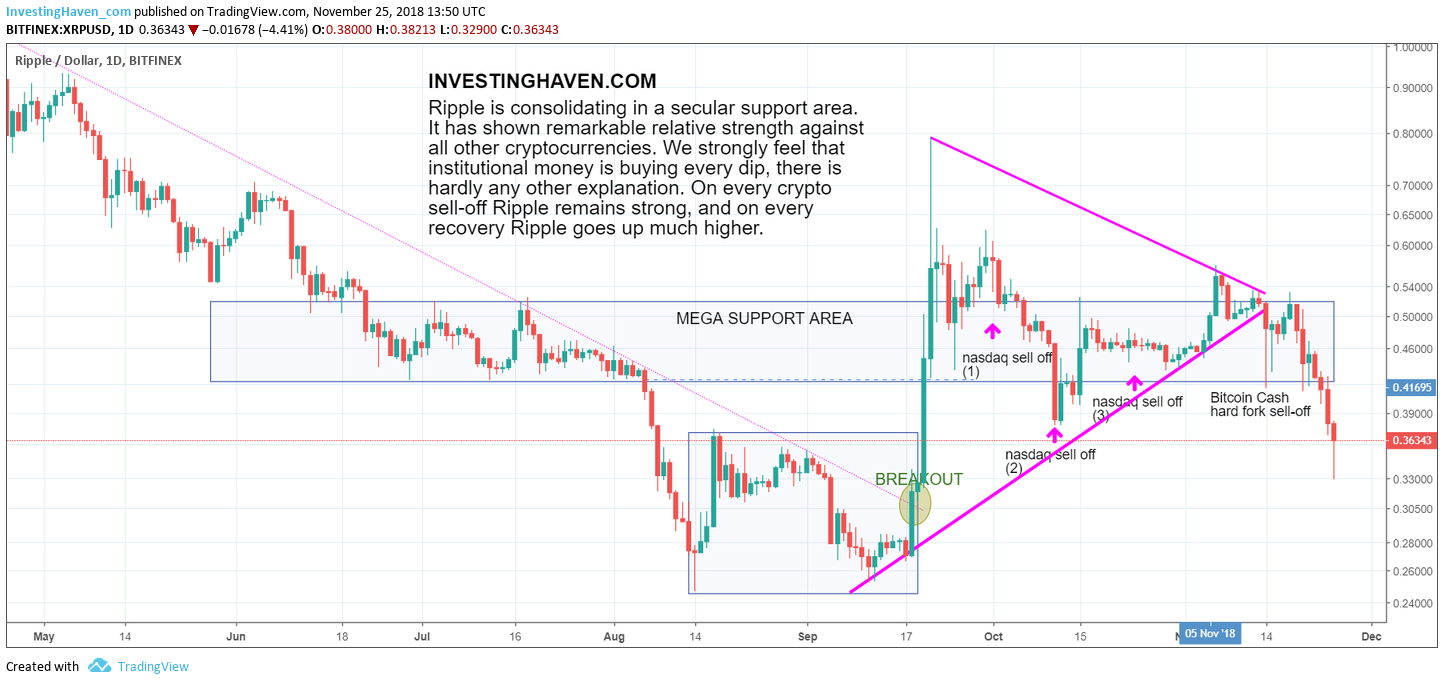
Update on 25 November 2018
It’s official. Bitcoin continued its breakdown, and, because of that, Ripple broke now convincingly down from its short term triangle pattern. It also lost horizontal support (blue bar on below chart).
What does this mean?
In the short term, there is more downside, and we believe that the recent lows from August/September will hold.
In the long term, this is setting up for a major buy opportunity. That’s also what said today in our article Bitcoin: An 81 Pct Decline Suggests A Major Bottom Is Near In 2018. Note that this is the opposite of what we wrote on Dec 31st 2017 when we called for a major top. Today we are on record calling for a major bottom which is near, implying a major buy opportunity, first and foremost in Ripple’s XRP token! Time will tell whether we will be right.
More detailed crypto forecasts and tips? Subscribe to the First Blockchain & Crypto Investing Service In The World >>