
Silver will move higher in 2024 because the top in Yields is confirmed. Silver and Yields are inversely correlated. Our silver price forecast 2024 is supported by 4 leading indicators: Yields coming down, US Dollar flat, inflation expectations on the rise, silver CoT data very bullish. Based on these data points, our silver price forecast for 2024 is $34.70.
Related – When Exactly Will The Price Of Silver Start A Rally To $50?
Nowadays, the web is full of fake silver price forecasts. Many sites publish large tables, generated by AI, with price calculations for the next years, positioning those endless series of numbers as silver price forecasts.
Silver forecast analysis: outline
We have a very different view on how to predict the price of silver. If you are looking to understand the true dynamics driving the silver price, you will love our silver price prediction methodology.
- 1. Silver prediction: summary
- 2. Another Silver Price Prediction: Why?
- 3. Leading indicators supporting our silver price prediction
- 4. Our silver price prediction 2024
- 5. Silver charts that support our forecast
- 6. Silver’s leading indicator #1: Gold
- 7. Silver’s leading indicator #2: Euro (USD)
- 8. Silver’s leading indicator #3: Inflation expectations
- 9. Silver’s leading indicator #4: Futures market (CoT)
- 10. Physical silver market: physical shortage in 2024
- 11. Silver price chart: a bullish reversal is almost complete
- 12. Silver price forecast 2024: conclusion
- 13. Silver price prediction Log (2024 update)
- 14. Our track record predicting the price of silver
- 15. Track our silver forecasts
What is the single most important influencer of the price of silver in order to meet our silver forecast 2024? There are two influencers: silver CoT and 10-Year Yields.
Note that silver’s dominant price influencer, primarily price setting in the futures market, is a structural problem. The fact that the futures market determines price, not supply/demand, is in fact the widely known and accepted silver price manipulation, a topic not included in the scope of our silver forecasting analysis.
Silver prediction: summary
We re-iterate our bullish stance about the silver market. Our silver price target stands strong.
The summary of our silver forecast 2024:
For 2024, we continue to predict that silver will rise to 28 USD/oz which is a secular breakout level. Whether it will succeed in clearing secular resistance will depend whether 10-Year Yields will confirm a local top. Stated differently, TNX is the last obstacle for silver to move higher. Once silver moves to 28 USD/oz, it will run quickly to the 32-36 area, a move which we expect to occur in the first half of 2024.
As 2024 is about to kick off, we firmly believe that silver has everything that it needs to stage a secular breakout early 2024, maybe even short term. Note that we define ‘short term’ as 3 weeks to 3 months out. In other words, our expectation is that silver will break out in the first part of 2024. That’s why we prefer to wait for silver to clear 26 USD/oz which will open the door to move to 28 and 34.70 USD/oz.
Related – Can The Silver Price Rise To $100?
Another Silver Price Prediction: Why?
The internet has no shortage of silver price predictions. In fact, InvestingHaven was the first back in 2015 to publish a silver price prediction and repeat it every year. Since then, the number of silver price predictions has exploded. Most of them are absolutely worthless.
We pride ourselves not only being the first one to publish a silver price prediction but also do it in a very diligent way, backed by thorough research.
What’s more, nowadays, you can find any type of ‘opinion’ and ‘personal viewpoint’, from anyone, including serious analysts with lots of experience but also inexperienced ‘influencers’ only interested in maximizing social media reach. Case in point: the $silver feed.
We want to think differently.
What we are really interested in is catching the next really big move in silver that might bring it back to 50 USD/oz or even higher. That’s the reason why silver has a top spot in our watchlist.
We write a lot about silver both in the public domain but also in our premium services. Silver has a track record of running very hard and fast, in both directions. There is a very good reason why silver is called the restless metal.
4 leading indicators supporting our silver price prediction
We work with a limited number of leading indicators for our silver price predictions:
- The price of gold (positively correlated to silver).
- The Euro (inversely correlated to the USD).
- Inflation expectations (positively correlated to silver).
- The futures market positioning (CoT).
In 2022, we noticed how a strong rise in the U.S. Dollar and consequently big decline in inflation expectations broke the secular breakout in silver that started in Q1. However, the silver CoT report continued to improve to the extent that it became historically bullish in Q3.
We believe that all leading indicators will turn bullish for silver in 2024, the only one that needs confirmation is 10-Year-Yields: if prices of Treasuries move a little higher, Yields a little lower, it will open the door for silver to finally take off.
Our silver price prediction 2024
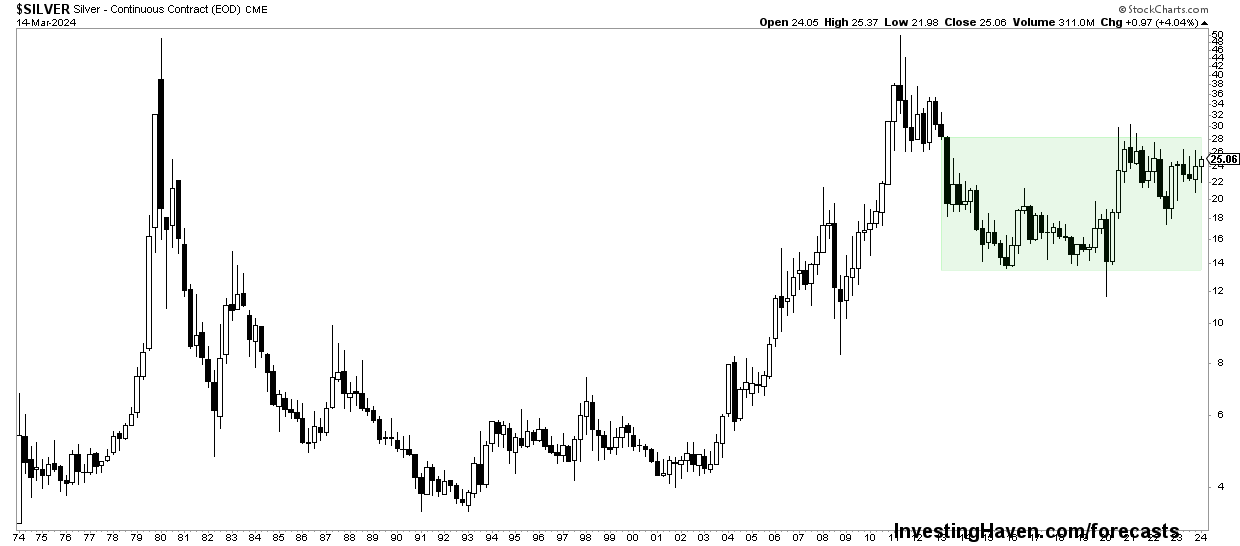
We turn to the silver charts to support our silver price forecast 2024.
As seen on the longest timeframe, the silver price chart over 50 years, there is a giant cup and handle in the making. This is a strongly bullish pattern, one that might take two more years to truly explode.
The area in green is the ‘handle’, it took some 6 years to create the first part of the structure. The consolidation is taking some 3 years now. We find it challenging to estimate the exact time required for this formation to complete. We can reasonably expect silver to move to the top of this formation (between 32 and 36 USD) in the first half of 2024.
Chart commentary: this chart was updated on March 15th, 2024, to ensure an up-to-date quarterly silver price chart. This cup-and-handle reversal is getting stronger with each passing month and quarter. A breakout is in progress, on the daily timeframe and soon on the weekly timeframe as well. On the quarterly silver price chart, the breakout will be in progress once 25 – 27 USD/oz is being cleared.
Silver charts that support our forecast
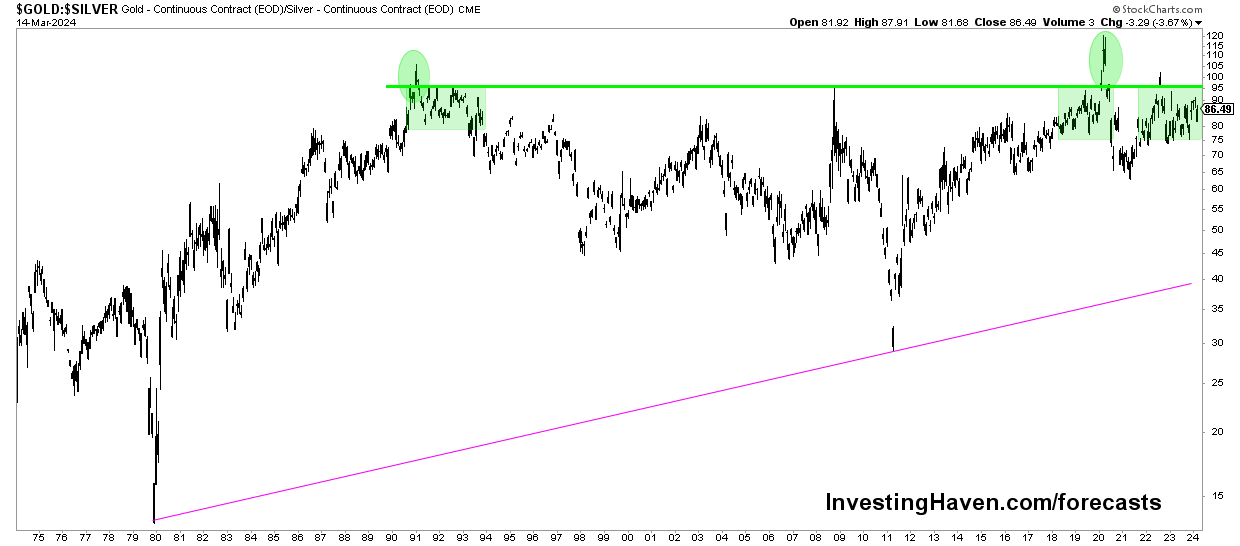
We start with the weekly gold to silver ratio over 50 years.
We explained the importance and the meaning of the gold to silver ratio, in great detail, in this article: Gold-to-Silver Ratio and Historic Silver Rallies:
The historical evidence suggests that the gold-to-silver ratio entering the 80 to 100x range may act as a signal for a significant rally in the price of silver. At this very point in time, the gold to silver ratio chart embedded in this article shows how this ratio is above 80x since early 2022. This ratio is not a timing indicator, it is a stretch indicator. It suggests that silver is extremely undervalued relative to gold, it suggests that it’s a matter of time until spot silver starts reacting to the upside!
The gold to silver ratio chart over 50 years:
The 2nd chart that supports a higher spot silver price in 2024 is the correlation between inflation expectations (TIP), gold and SPX.
The decline in 2022 in all 3 of them is telling. We expected that all 3 of them will stop declining and turn up in 2023, which happened although without follow-through.
With the correlation between those 3 markets in mind, we look at the current setups in silver / TIP / SPX.
Silver is setting a very strong inverted head & shoulders pattern, stocks are setting a double bottom (pending validation though), TIP looks to be consolidating.
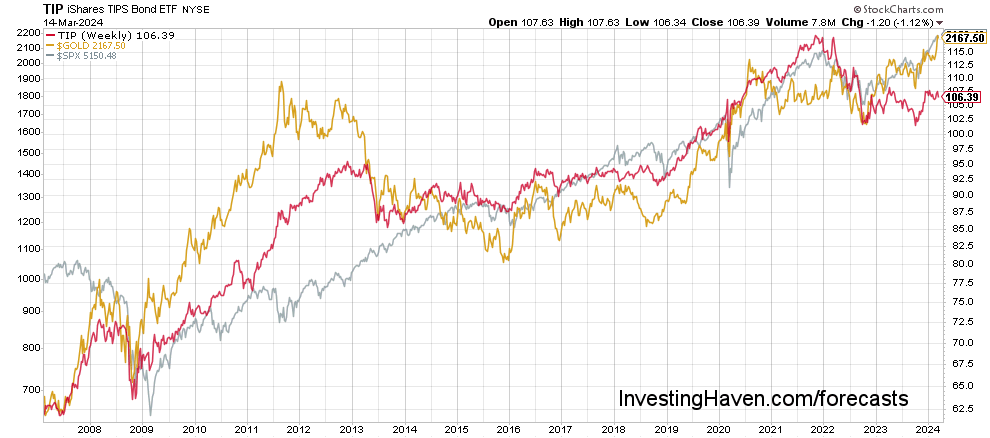
We believe all 3 instruments will move higher in 2024.
Silver’s leading indicator #1: Gold
We expected gold to eventually move higher in 2023, and it happened, driven by the divergence between its leading indicator M2 (the monetary base). The way we look at this leading indicator is that it is now supportive while it had a negative divergence a while ago.
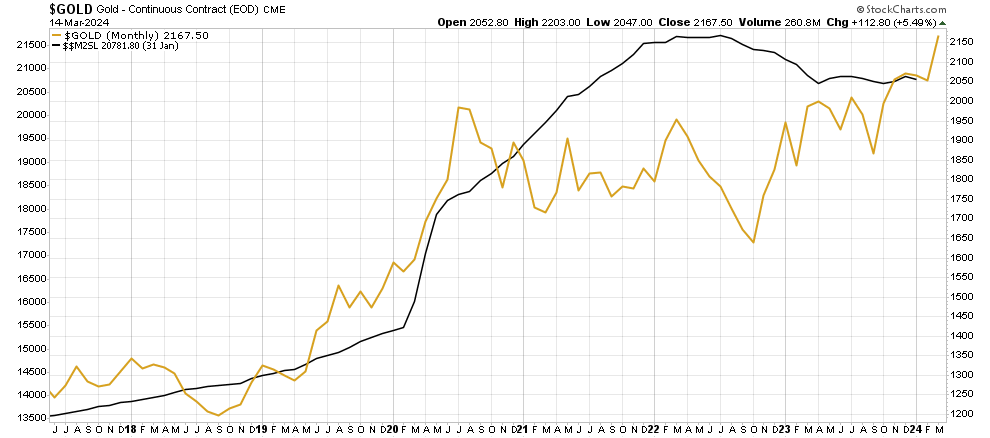
We gave much more detail about the expected path of gold in 2024 in our gold forecast.
Silver’s leading indicator #2: Euro (USD)
Precious metals need a rising Euro (falling or flat USD) in order to shine.
If we look at the Euro chart on the longest timeframe we find 2 bearish targets: 0.9666 and ultimately 0.91-0.92. The first one was hit, the second one might be hit (or not).
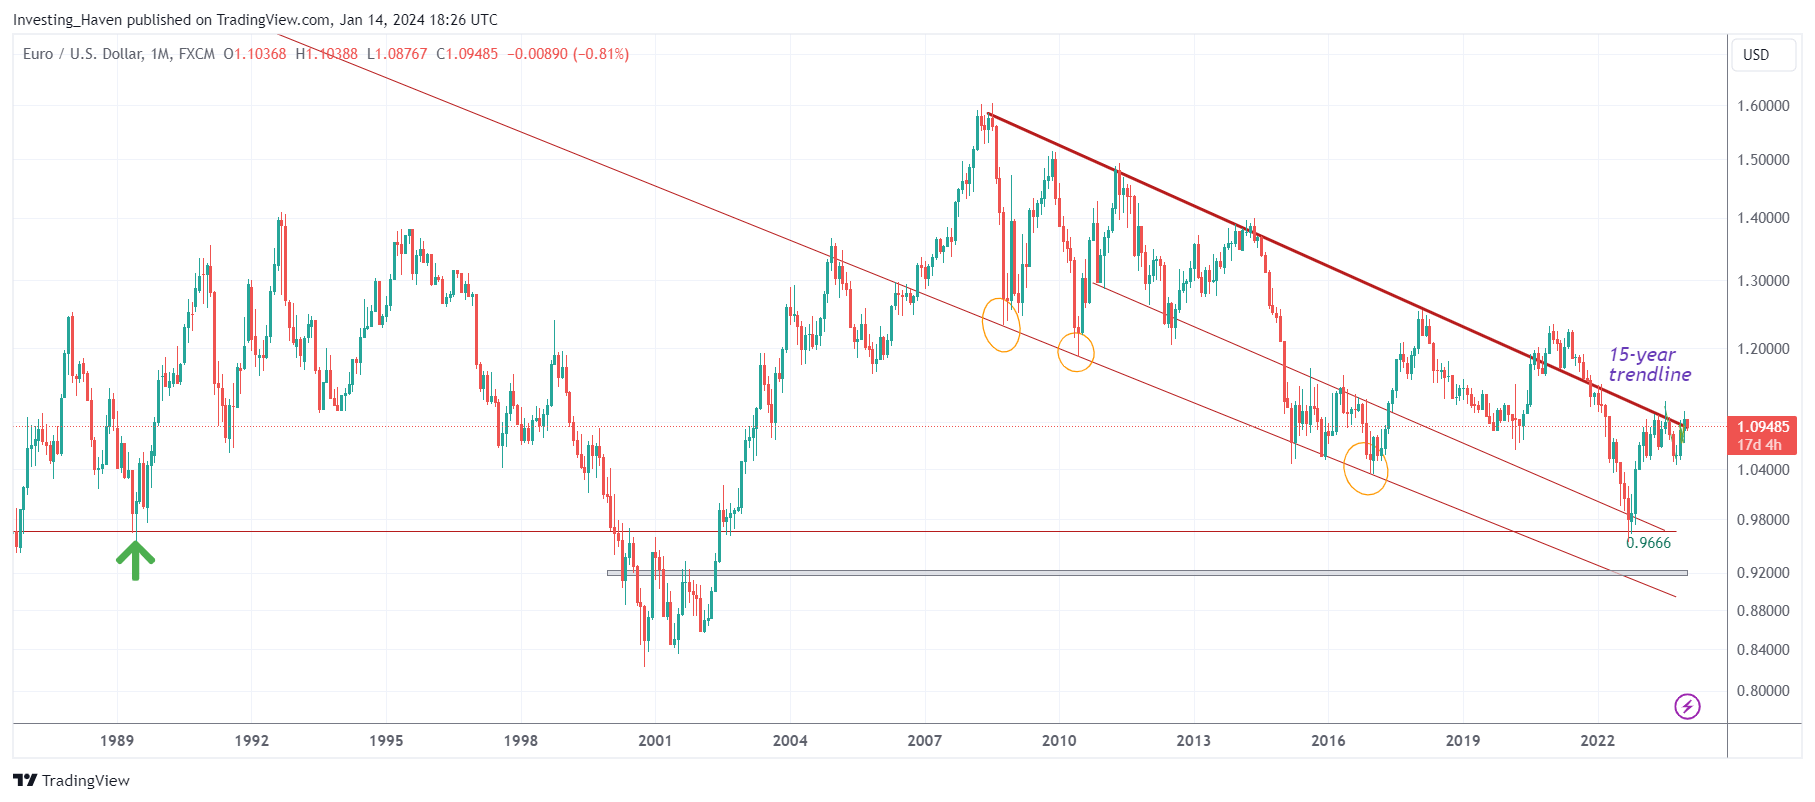
Stated differently, even though it might be that the U.S. Dollar has more upside (more downside in the Euro), we believe that there is more downside risk in the USD than upside potential. Pending validation and an important pre-requisite for our bullish silver price forecast 2024 to materialize.
Silver’s leading indicator #3: Inflation expectations
Inflation expectations are positively correlated to precious metals. They are a very strong a leading indicator, certainly when combined with the USD/ Euro effect.
The long term setup in TIP seems to be hitting a multi-decade low in the context of its rising channel. Can TIP move lower? While everything is possible, we see that the recent decline was equally large as the previous ones in 2008 and 2020. That’s why we believe TIP is about complete its consolidation and move higher in 2024. We see a double bottom between Oct 2022 and Oct 2023 which should resolve higher, making it possible for silver to stage its long-overdue and long-awaited rally in the first half of 2024!

The medium term chart of silver / SPX / TIP, shown below, makes the point: a turning point in all three markets is not far away. All three should resolve higher in 2024, even if they decide to continue their downtrend before 2024 starts.
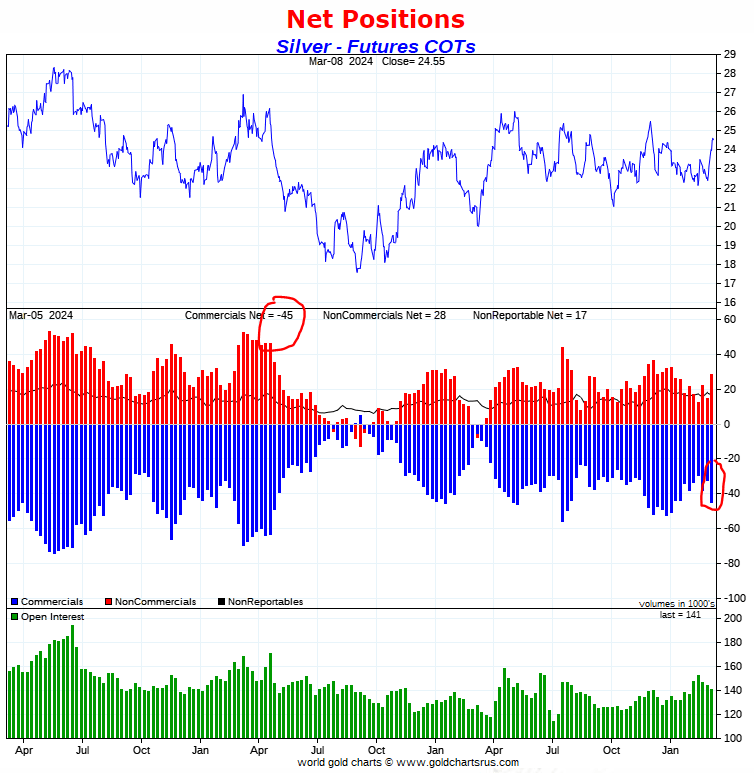
Silver’s leading indicator #4: Futures market (CoT)
This is the most bullish leading indicator for silver, way before 2024 kicks off. This leading indicator will act like fuel in 2024 whenever the other leading indicators turn bullish for silver!
The way to think of this leading indicator for silver is a stretch indicator:
- When net positions in the futures market of commercials and non-commercials are stretched it indicates that price is going to take a turn.
- This is not a timing indicator, we need the silver price chart to determine the timing of a turning point.
- Right now, as per the data on the center pane (blue and red bars) we see that commercials and non-commercials have extremely low net positions, historically low. This is a setup that supports rising silver prices.
- What we want to see in 2024 is the red and blue bars rising not so fast as the price of silver is moving towards 28 USD, the secular breakout point.
We recommend reading Ted Butler’s work who is the expert in reading the CoT report in silver. He also explains how price setting in the silver market is dominated by CoT. He is a lonely voice in pointing out how tight the physical silver market currently is, as we head into 2024, because of an epic turnover in physical silver warehouses.
Comment added on February 12th, 20243: The silver CoT report remains very bullish, from an historical perspective. There is plenty of upside potential in the price of silver before it gets stretched. The risk/reward is skewed to the upside.
Physical silver market: physical shortage in 2023 & 2024
As discussed in our recent article that talks about the developing silver shortage, a supply deficit is growing in the physical silver market.
According to The Silver Institute) the global silver market should record a deficit in 2022. “At 194 Moz, this will be a multi-decade high and four times the level seen in 2021.”
As seen on the table which depicts the supply/demand situation in the last 10 years, it becomes clear that 2023 will be year with a structural and undeniable physical market shortage. The strength of the physical shortage is the one conclusion that stands out, see red annotation.
As said, “this physical market imbalance (supply shortage) is historic, it’s not just a big supply shortage jump of 4x against last year.”
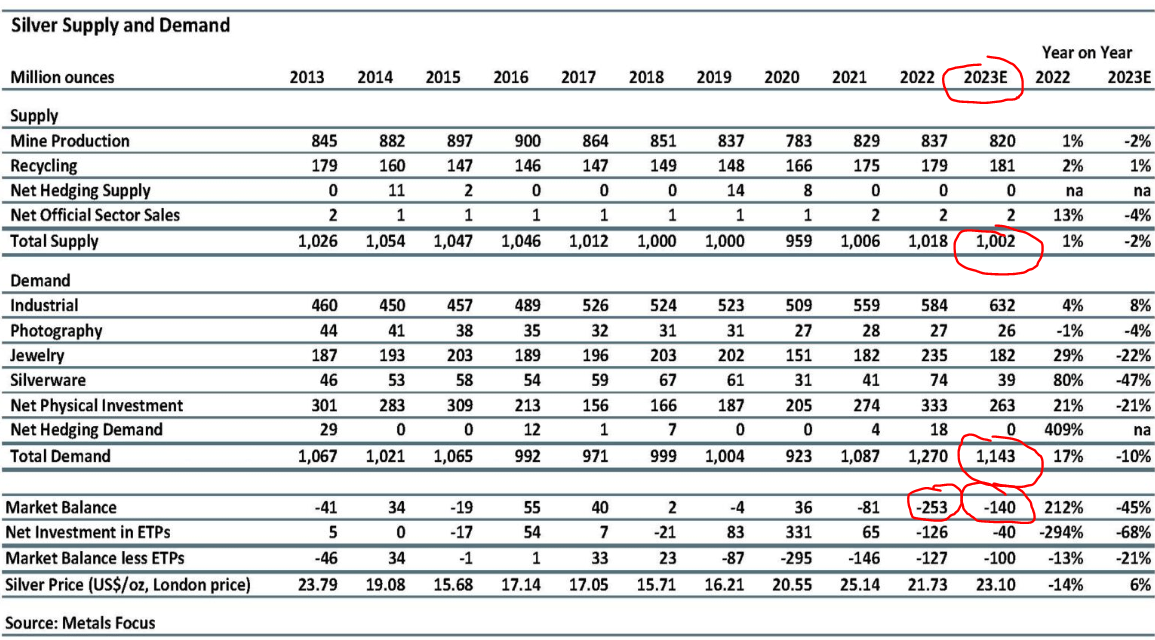
The shortage did not resolve in 2024. In fact, there is an increasing number of signs that the shortage is only intensifying. Sooner rather than later, silver’s physical market shortage should be reflected in the price of silver.
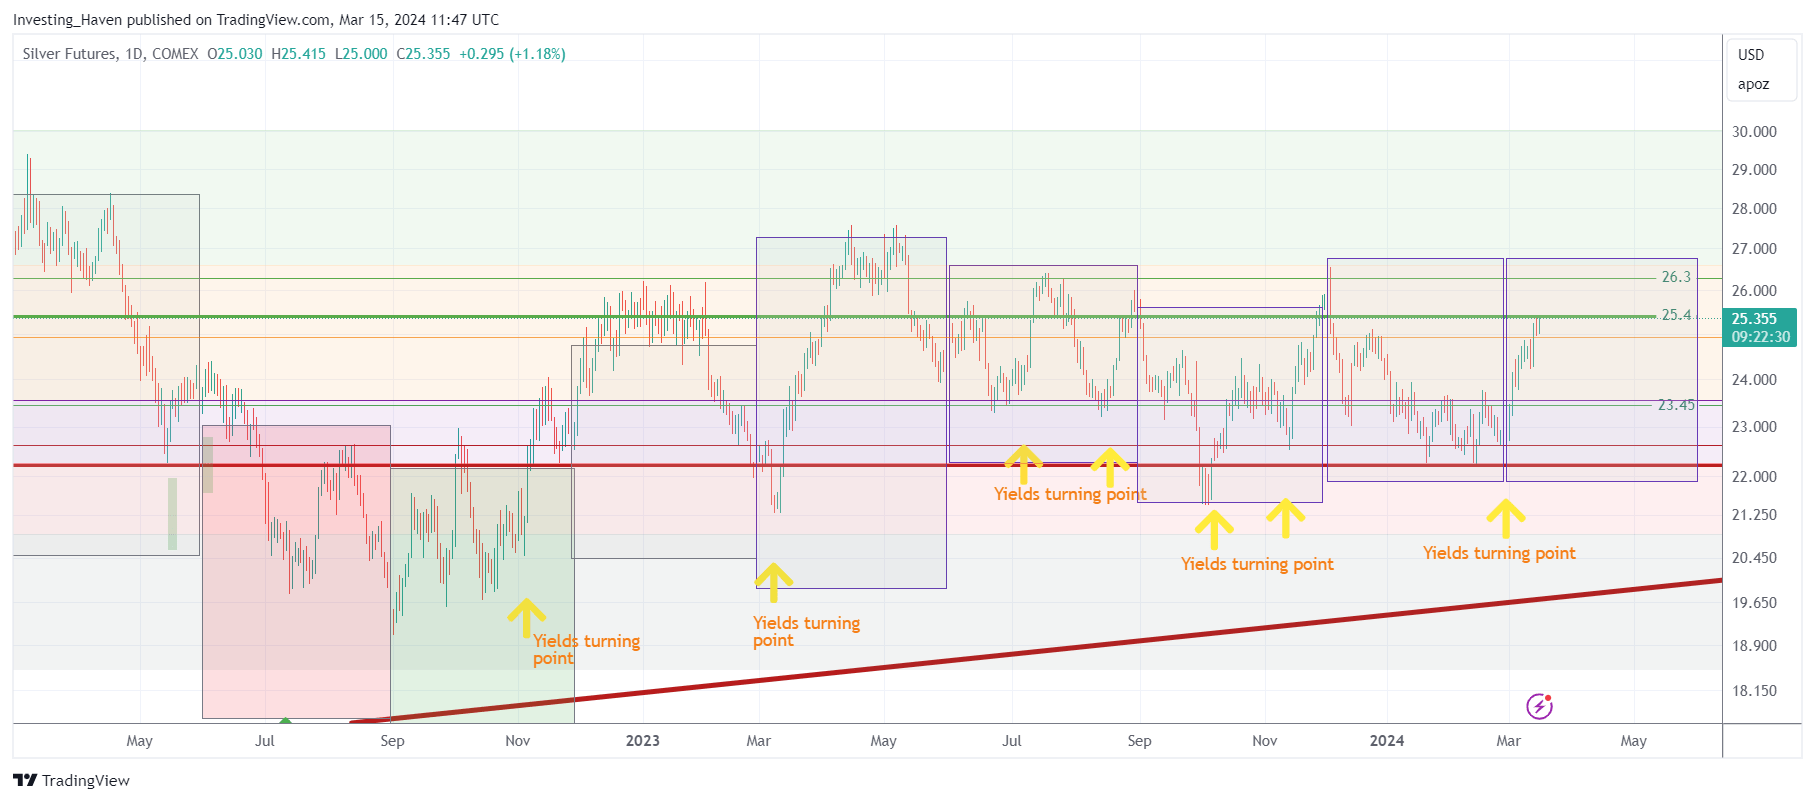
Silver price chart: a bullish reversal is almost complete
A bullish reversal setup that is testing the edges. While not really visible on this chart, there is a rounded pattern that already resolved and is testing the breakout point (23 USD/oz).
[Nov 26th, 2023] A breakout is almost confirmed on the daily chart. However, on the weekly chart we need silver to cross 25 USD/oz as the breakout level.
[Dec 11th, 2023] The price of silver experienced a steep drop in the first week of December of 2023. It created a local top on the silver price chart, with a structure that looks a lot like the start of a reversal. W
[Feb 12th, 2024] Silver remains sticky around the 23 USD/oz level. This level coincides with the 50% retracement between the 2020 highs and 2022 lows. Any 50% retracement level on any chart / stock / commodity, in any market, is just such a crucial level.
[March 15th, 2024] Silver is now working on a bullish reversal, one that started in May of 2023 and might be complete in this current 3-month cycle March 2024 – May 2024. A breakout must happen in this current 3-month cycle for silver to move to our bullish target of $34.70.
Remember, the longer a consolidation goes on, the more powerful the outcome will be. While, emotionally, a long consolidation is no fun for most investors, the reality is that the longer term implications of a long consolidation are bullish.
Silver price forecast 2024: conclusion
That was a lot information to take in, so let’s ensure we come to a very clear and simple conclusion:
- Leading indicators Euro and inflation expectations turned bearish in Q2/2022, pushing silver lower.
- The silver CoT turned extremely, historically bullish as we head into 2024.
- Once inflation expectations start rising, accompanied by a confirmed top in 10-Year Yields, we silver see taking off.
That’s why we see silver easily moving to 28 USD in 2024 and moving to our first and longstanding bullish target of 34.70 USD. Our silver price forecast 2024 is 34.70 USD. Whatever happens at that price point will inform us about the intention of silver to attack ATH, presumably beyond 2024.
Our track recording predicting the price of silver
Between 2017 and 2021, our silver forecasts were phenomenally accurate. Those silver predictions are all still available on our public blog. The table below depicts the summary of each year’s silver forecast with the highs/ lows per year.
Interestingly, InvestingHaven’s research team has been spot-on with its gold price forecasts for 5 consecutive years. However, in 2021 and 2022, the price of silver came close to our silver forecast but eventually did not exactly touch our forecasted price.
We firmly believe that our silver price forecasts of 2022 and 2023 will materialize in 2024. Our longstanding targets are 34.7 and 50 USD, they should be met and probably exceeded in 2024 and 2025.
This is an overview of our silver price forecasts from last year. We publish these forecasts many months prior to the year that we forecast. Prices reflect silver's spot price.| Year | Our silver forecast | Lows Highs | Forecast accuracy |
|---|---|---|---|
| 2017 | Neutral, price target of $15 | 14.41 18.65 | Spot-on |
| 2018 | Neutral, no breakdown | 13.91 17.68 | Spot-on |
| 2019 | Bullish with price target of $20-21 | 14.30 19.64 | Spot-on |
| 2020 | Bullish with price target of $22 | 11.65 29.64 | Spot-on |
| 2021 | Bullish with price target of $37 | 21.42 30.37 | Missed |
Our #silver price forecast for 2024 is bullish with a price target of $34.70. Silver's leading indicators are bullish in 2024. Once $34.70 in spot silver is achieved, $SILVER and $SLV will move fast to test $50, most likely in 2025. Click To Tweet
Weekly Gold & Silver Price Analysis
Our public blog posts typically share high level insights that are not actionable. For actionable insights, we recommend considering our detailed gold & silver price analysis. It is a premium service, covering leading indicators of the gold price and silver price. Premium service: Gold & silver price analysis >>
Must-Read 2024 Predictions
We recommend you read our 2024 predictions as they are very well researched:


