
One thing is clear: investors is tired. Not only do statistics show this, but also the interactions with our members suggest that this current wave of selling is pushing the limits of what investors can stand. Continuous volatility and an over-extended time of non-stop selling are causing investors to reach their ‘puke phase’. Be careful not to throw in the towel near a turning point because maximum pain occurs near major turning points, as explained in some of our investing success articles.
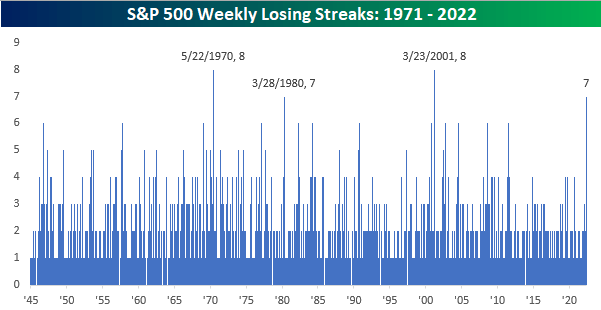
The market completed 7 full weeks of selling. That’s a wave of selling of 35 trading days. The average wave of selling is 15 days while a stretched waves of selling take 20 days to complete. This current wave of selling completed 35 full days!
In historic terms, the current wave of 35 days of selling qualifies as the most intense and extreme wave of selling in the last 80 (!) years. Only in two instances did we see a few days more than 35 days of selling as seen on below chart. Chart courtesy: Bespoke Investment.
Market participants are fed up with this market. It’s not just you, don’t worry.
This is what we wrote in our Trade Alerts weekend analysis (which we’ll repeat in our Momentum Investing weekend alert today):
Our viewpoint is that we are close to a bounce. It should be days away, not weeks. Maybe a few days, maybe 5 or 6 more days, but not more than that, is what we are thinking.
There are a few reasons why we think so:
- In terms of time, the current wave of selling is reaching levels of intensity only seen twice in the last 80 years.
- Anecdotally, we hear many investors complain about how exhausting this market is.
- Also anecdotally, a record number of stock downgrades were registered a few days ago.
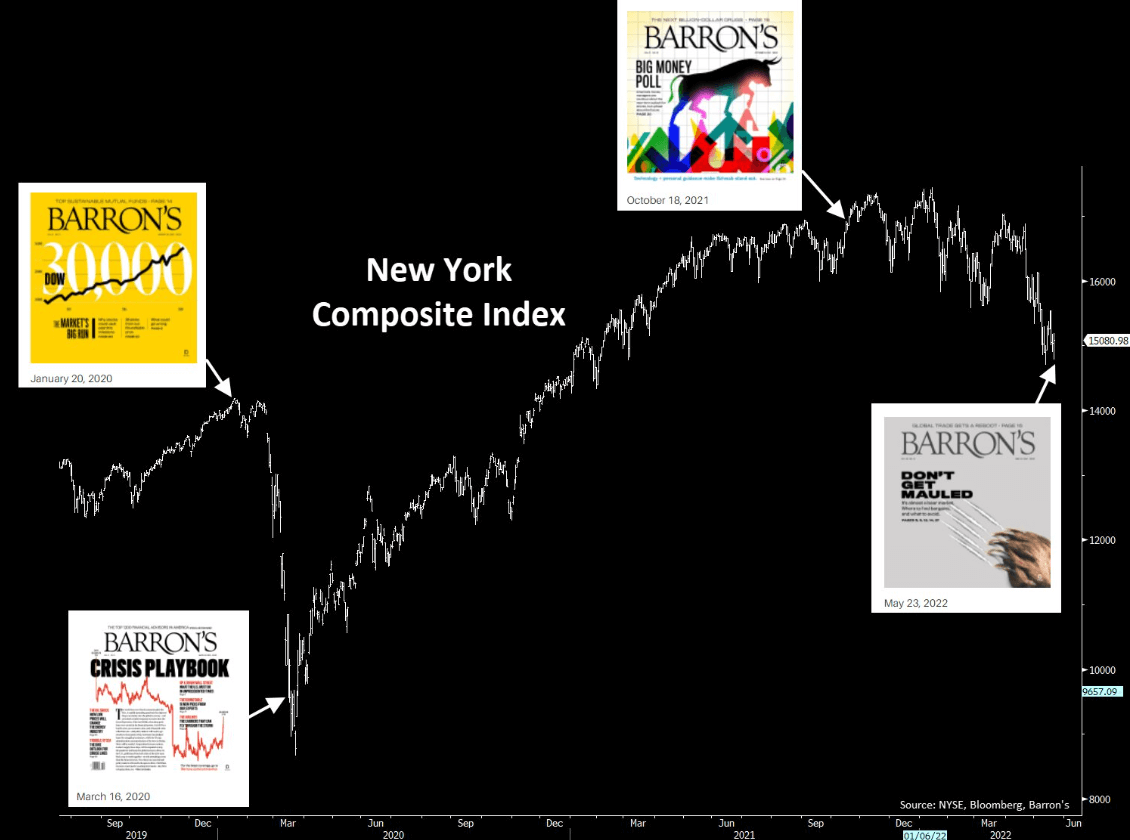
- Financial media, the perfect contrarian indicator, believes it’s time to exit.
More factually, we see one of our leading indicators getting tired as well: the Nasdaq volatility index.
The Nasdaq volatility index is looking tired, it can’t break up. The problem is that current readings create this constant selling pressure. We believe this chart says that it won’t take long, the end of selling should be near, it’s a matter of days (not weeks).
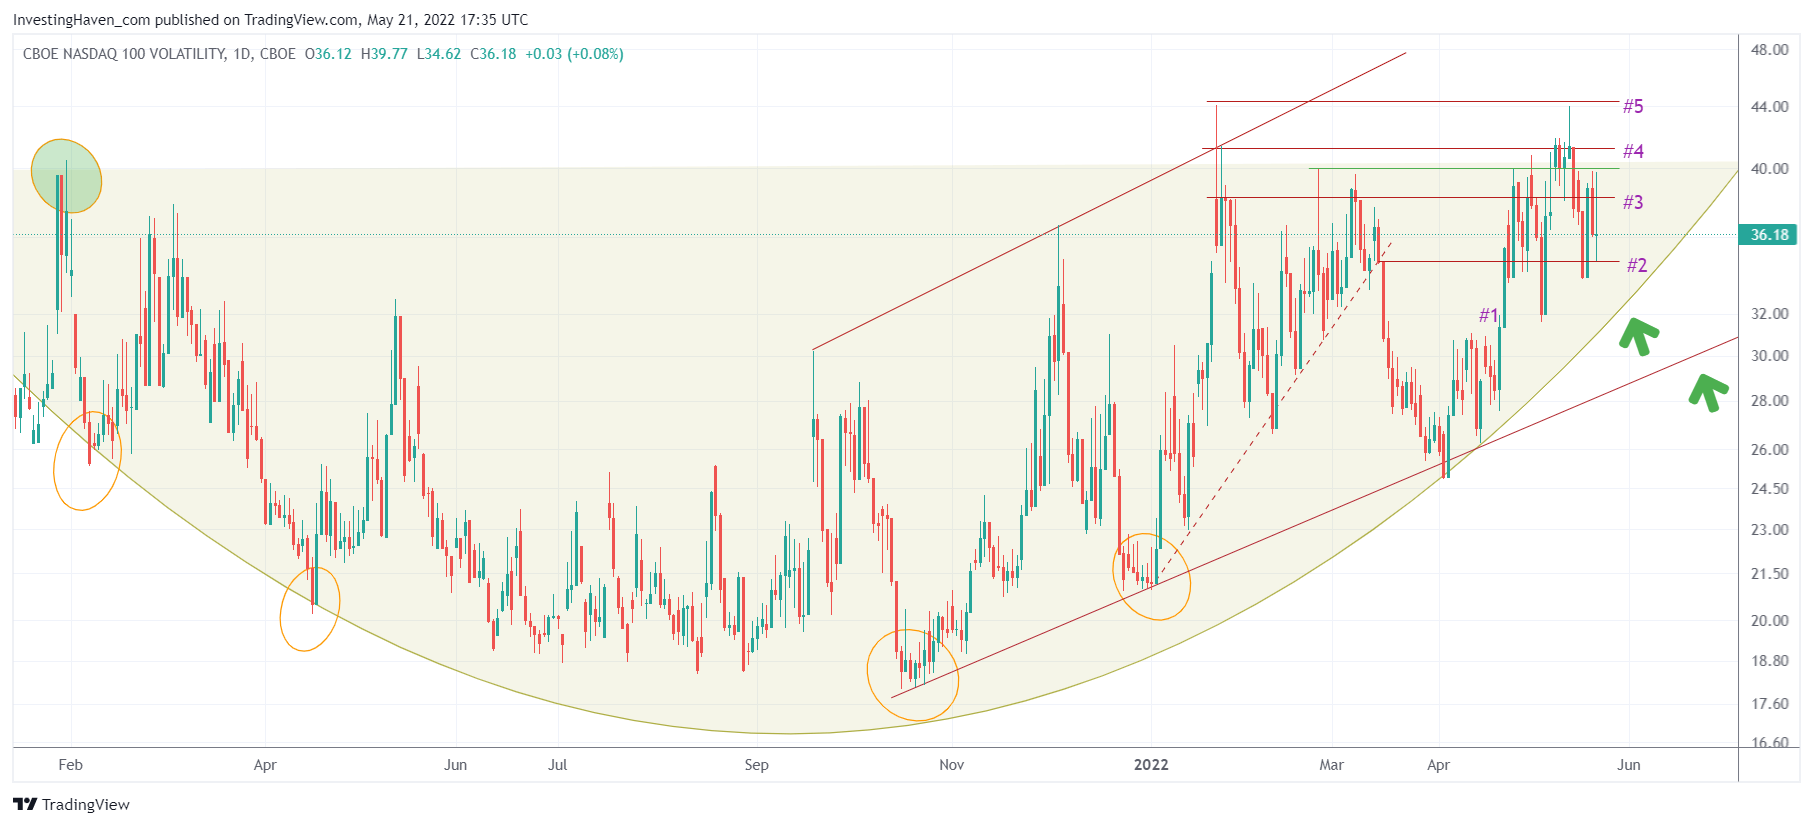
We analyze 6 different volatility indexes in our Trade Alerts weekend analysis and we consider the Nasdaq volatility index the most important one. Why? Because it has been the key driver of recent weakness in stocks.
Once this Nasdaq volatility index falls below point #2 on the chart we see it moving to the highest green arrow. Chances are high it will finally break down to move to the lower green arrow. It won’t take more than a few weeks until we get there, is our thinking.


