As described in our Australian Stock Market Outlook for 2020 and 2021 we expected a temporary retracement in the ASX index before continuing its uptrend in 2020. We said to buy the dip based on the outlook for 2020 and based on our 3 leading indicator for the ASX. Interestingly, it looks like the buy the dip moment is already there, just a month after publishing our insights. This outlook is one of our many annual market forecasts, and we wrote many forecasts for 2020 and beyond.
If we go back to our conclusion of our Australian stock market forecast we said this:
So as long as this trend continues which is what we expect given everything we outlined before we should see a 20% rise in 2020 and another 20% in 2021. However, the index is now at the top of the channel, not at the mid point, so we have to adjust for this.
And continued with our forecast on the ASX index in 2020 which looked like this:
That’s why we believe a fair forecast is for the Australian stock market to rise 20% (base case) to 30% (bullish case) in 2020 going into 2021. This assumes there will be a correction along the way, and we suggest to buy the dip.
If we look at the charts of the ASX index we see very interesting trend starting to take place now.
We’ll look at the ASX index charts but not in the usual top down way. We reverse the view, we’ll zoom in first and look at the longer term timeframes after.
The short term ASX index chart has this very interesting trend change. The short term trend since August 1st, 2019 was bearish. Between Sept and Nov we saw a triple bottom being set.
Today, we see the 2nd day of a break above this bearish short term channel.
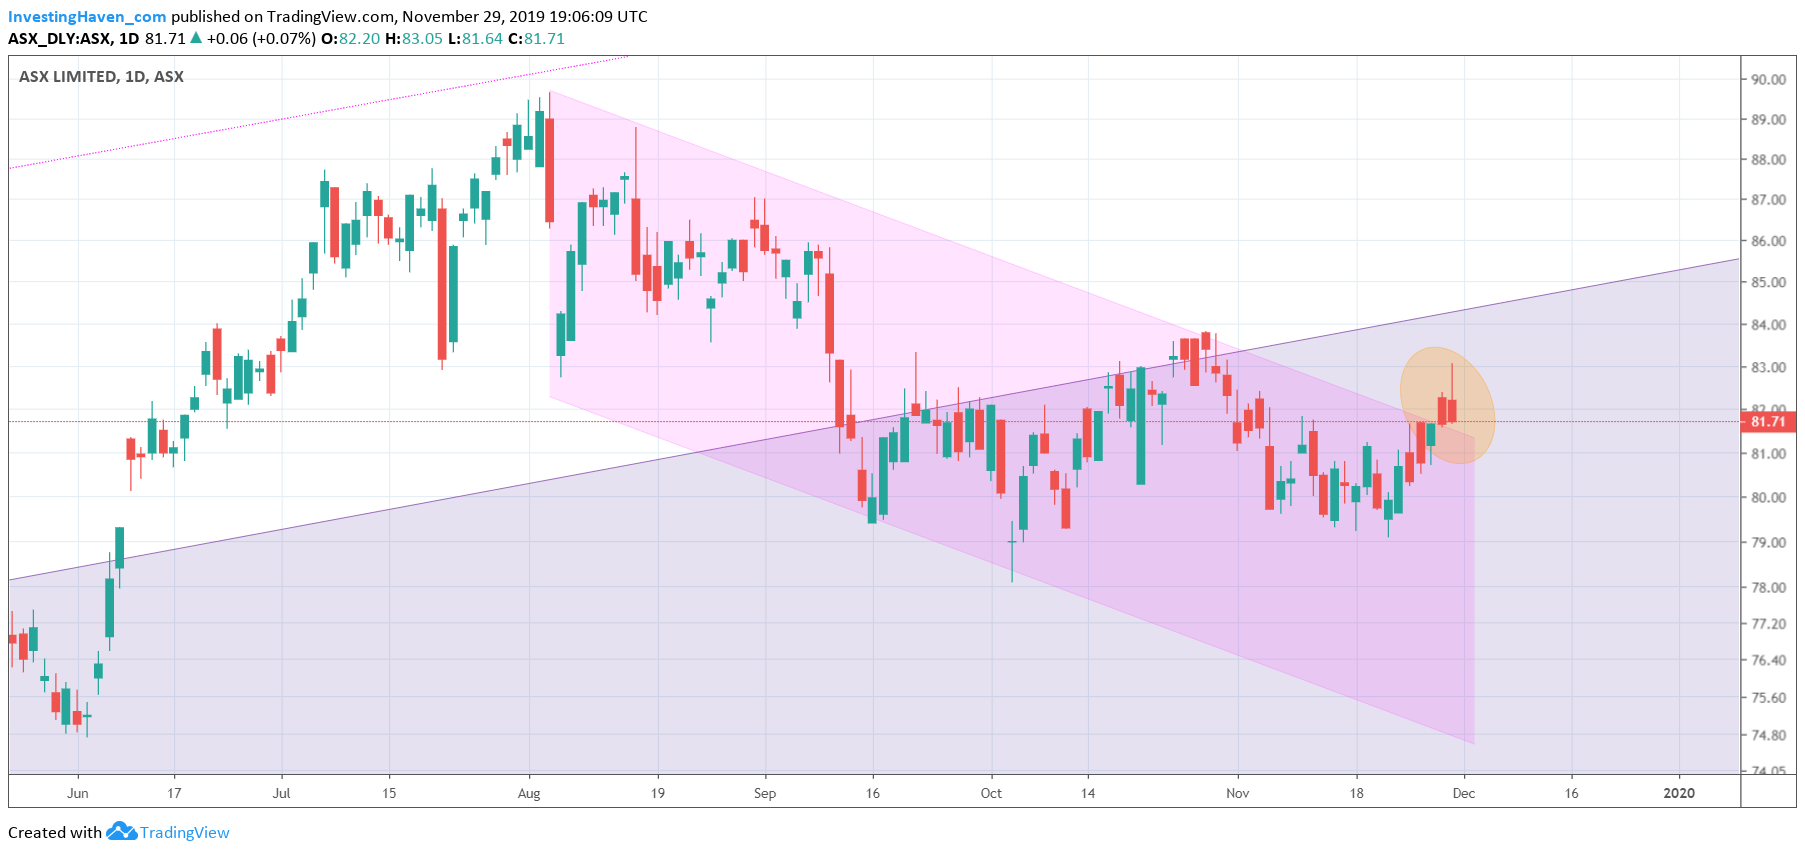
The key in this type of situation is to zoom out, and observe what this means in the bigger picture trends.
On the daily chart on 2 years we see that the ASX index declined in August after a major bullish breakout in June of this year. Interestingly, the triple bottom from the above chart coincides with a backtest of the breakout point in June. This is not visible on the above chart, only on the below chart (after zooming out).
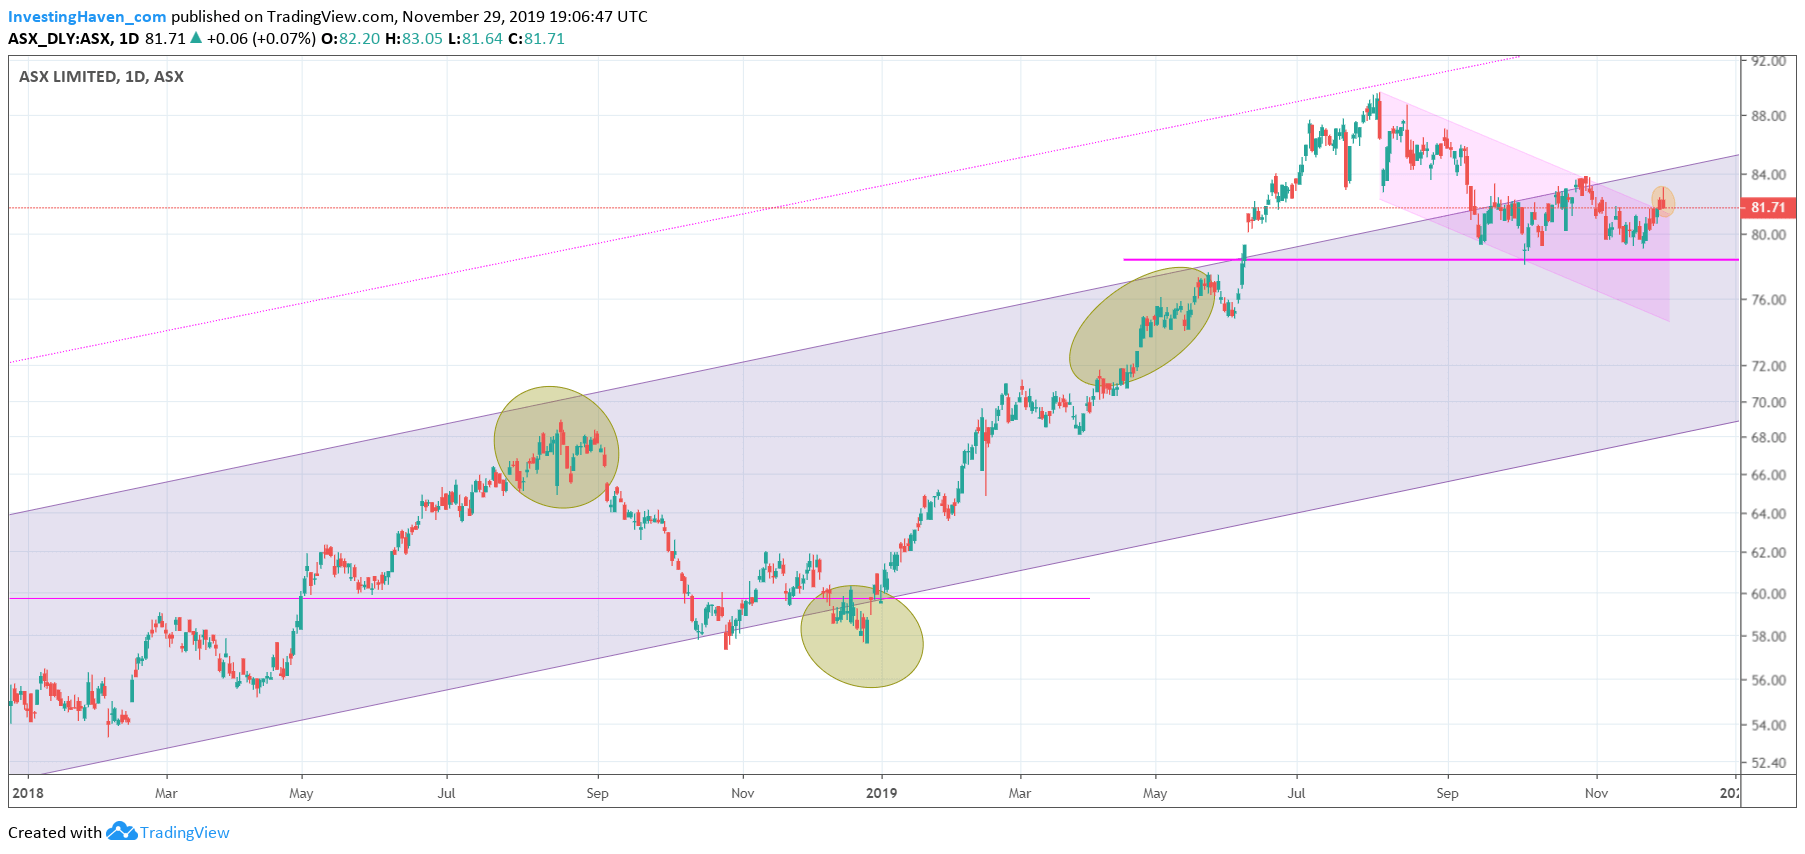
Needless to say the combination of the two charts above paint a very bullish picture for the ASX index going into 2020!
Yes the buy the dip is there, is what above charts say.
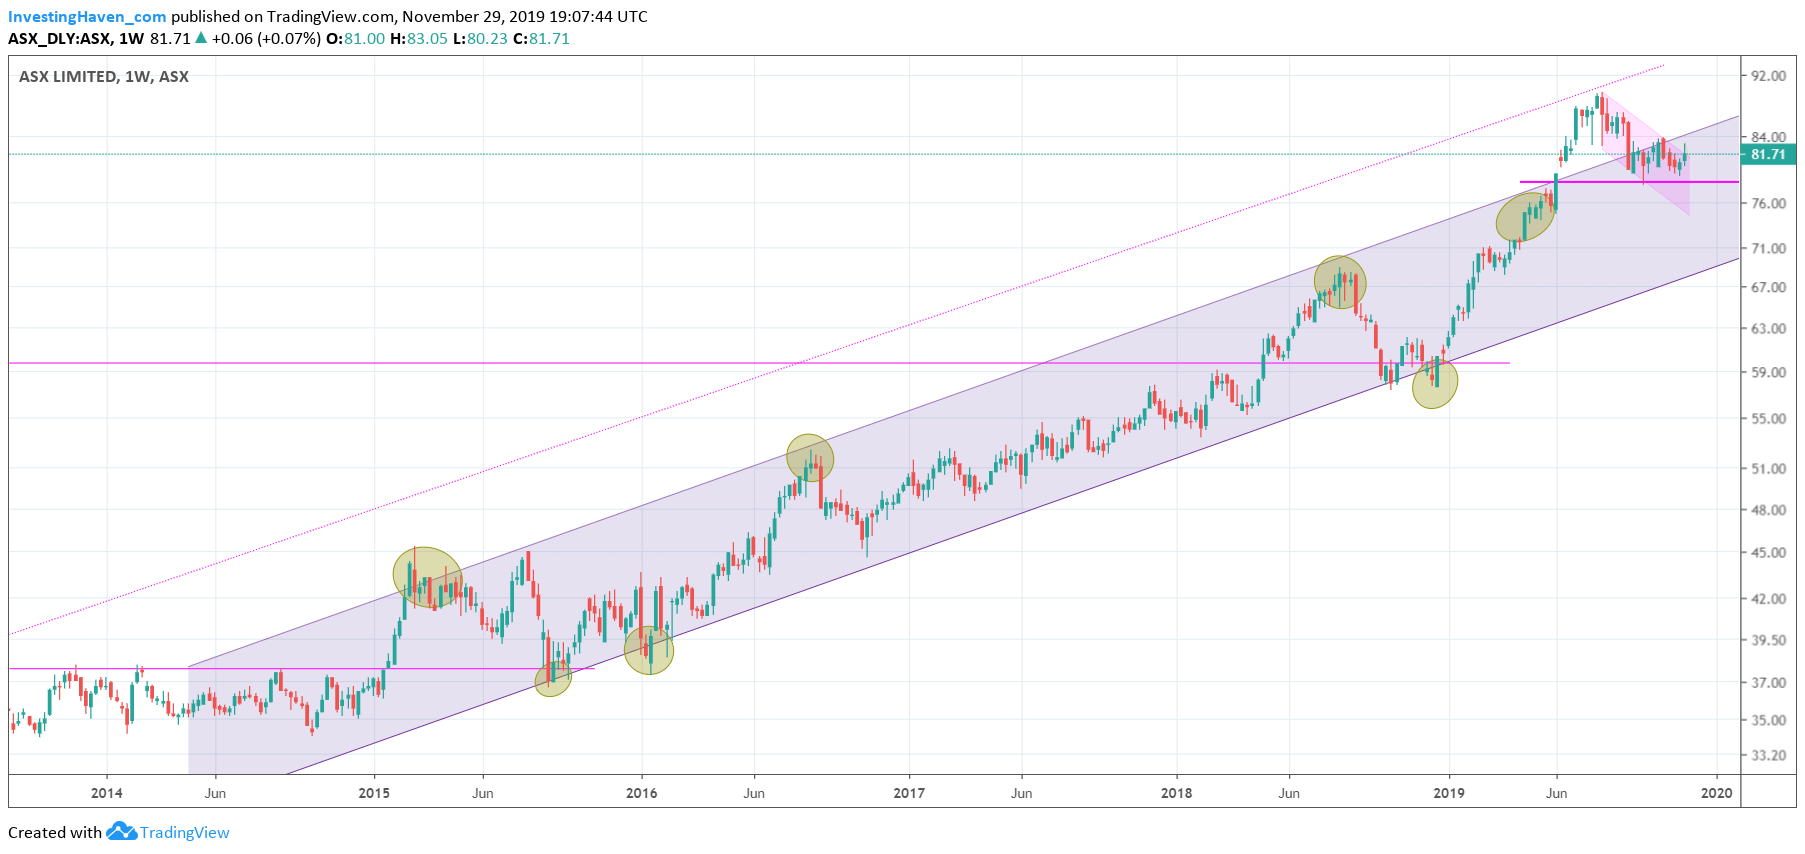
Combined with the monthly chart below we are convinced this is the buy the dip moment.
The monthly chart below shows this long term rising channel. It looks like the ASX index wants to move higher. As long as it trades above 78 points it is very bullish, and in the process of confirming our 20% annual rise.