
We covered the Euro a few weeks ago. The Euro is a leading indicator for global markets, it’s strongly influential in setting directions in different markets. We concluded that “March and April of 2021, especially the monthly candles we’ll see on this long term chart, might be telling.” We take a look at the medium and long term charts because March and April will be decisive months for global markets, and the Euro will help us understand the trends before the happen (as they happen).
In our previous article we showed the monthly Euro chart, and we recommend readers refresh their minds by checking the chart here: Leading Global Market Indicator: Secular Breakout Not Successful .. Yet
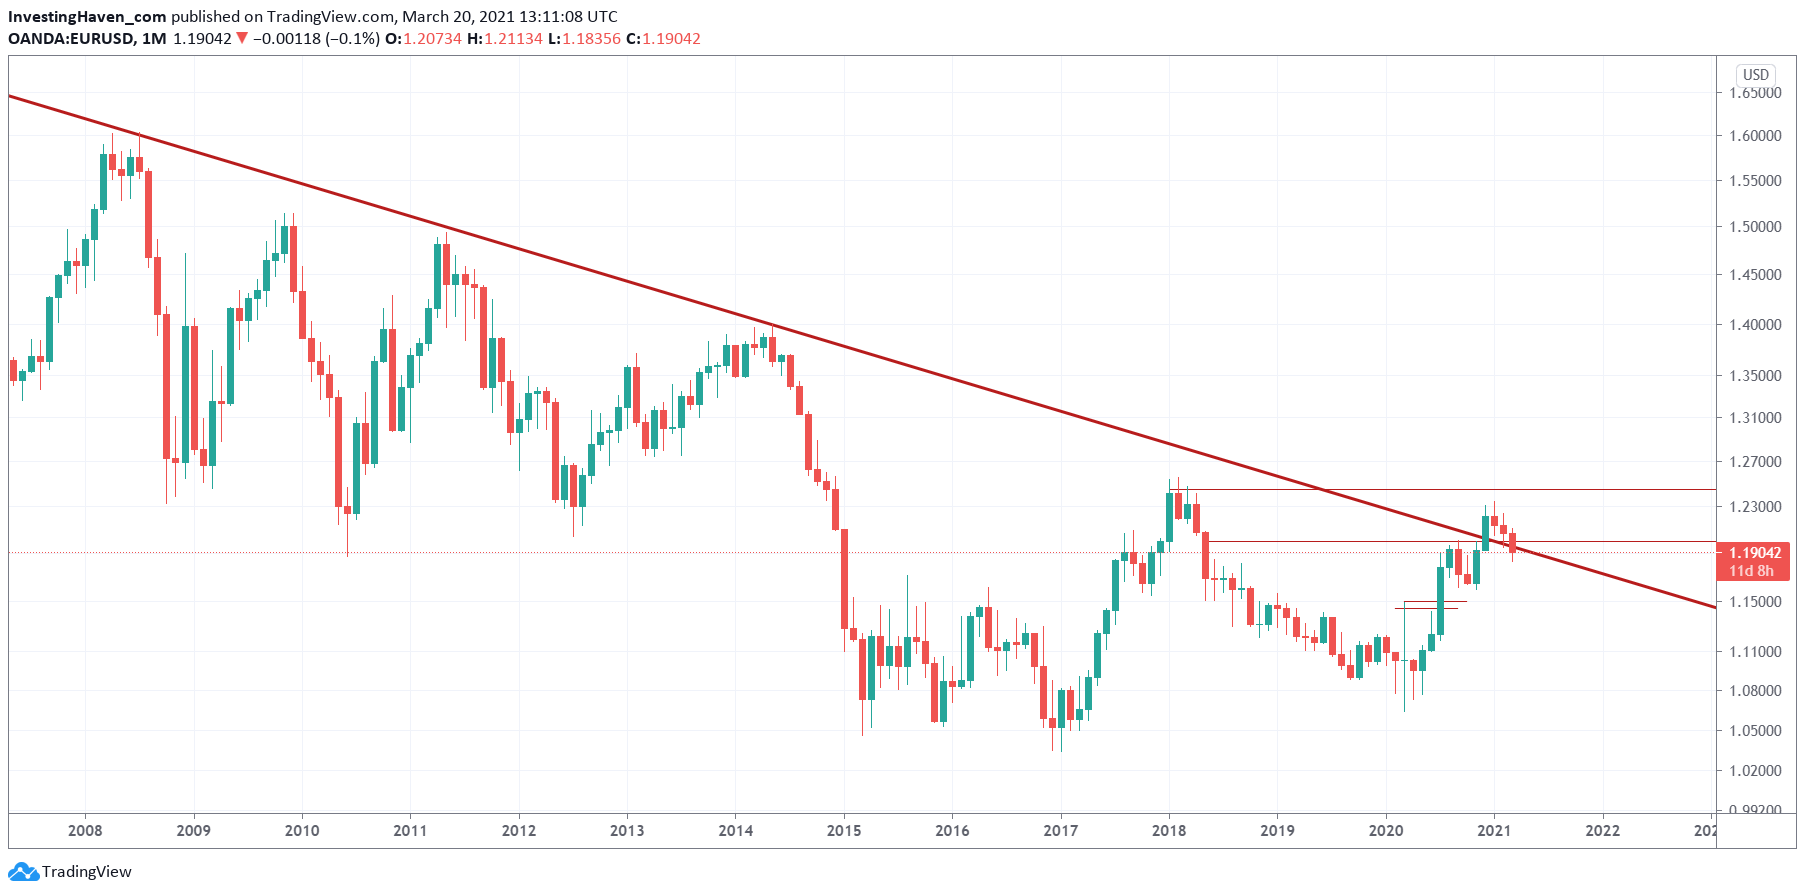
The most interesting finding from the secular Euro chart is that it recently tried to break out from its secular downtrend. However, it didn’t succeed.
The last 2 monthly candles, hard to see on the chart below, are not really great, but not concerning.
However, March will really be a crucial month. As in, really crucial. That’s because if the Euro sets a solid red candle we might see a topping pattern … in which case the picture would not look really promising. The opposite is true as well: a monthly close (way) above 1.20 would result in a small (or even tiny) red candle which wouldn’t imply a lot of damage was created on the secular chart.
We’ll have to watch the monthly close of the Euro, as it might be decisive for the stock bull market in 2021. A monthly closing price that is close to the open price of March 1st would be great.
If we check the up-to-date Euro chart, starting with the monthly, we see how March is close to printing the 3d red candle in a row. Moreover, the Euro is currently right below the red falling trendline which marks the secular bear market that started back in 2008.
 The closeup of the Euro chart, the daily, shows how bulls and bears are now fighting over control. The current level (1.19) is a hugely important level. Make no mistake, we are talking about a decisive level in secular trends that define risk-on / risk-off for global markets.
The red falling trendline from the above chart is visible on below chart. The grey box shows price action in the last 3 weeks, and it visualizes the ‘fight’ we just mentioned. It is happening right at the secular trend line.
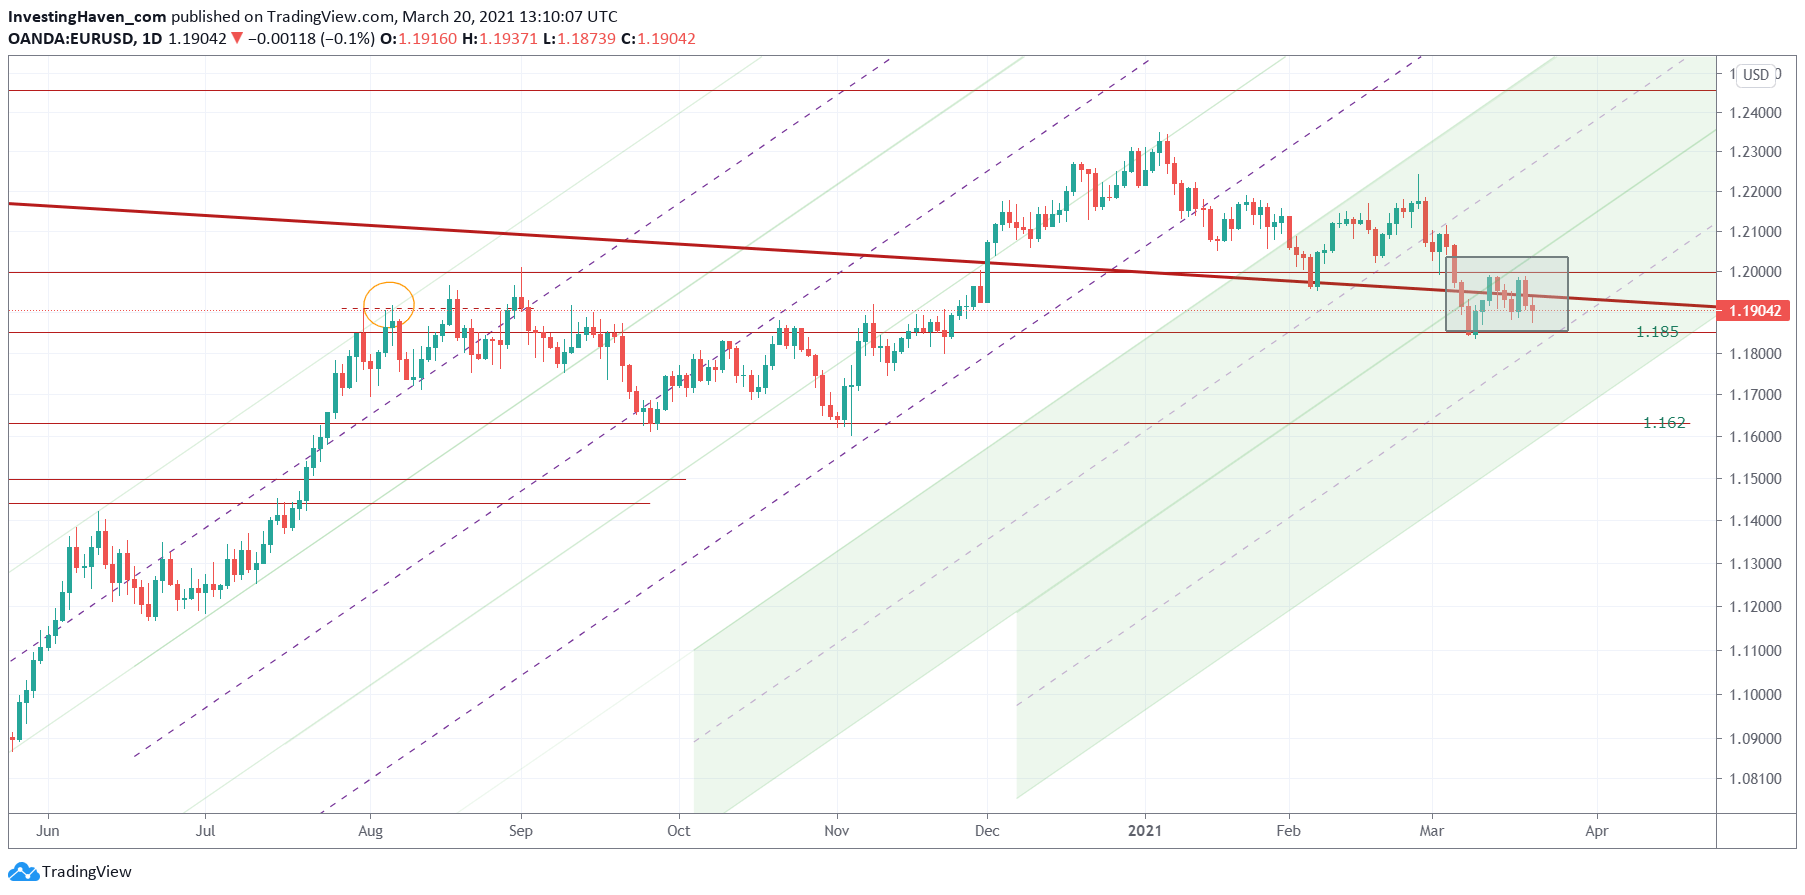 What all this means is that, after a massive RISK ON breakout in December markets are now ‘testing’ this breakout level. The importance of this is huge. If the Euro trades above 1.19 points on a weekly and monthly open/closing basis it will support RISK ON globally.
We call it ‘secular risk levels’, and the Euro suggests that global markets are in the process of ‘testing’ those risk levels.
We better pay attention to the Euro’s closing price of March, as well as price action in April, for stocks as well as commodities.
Enjoying our work? We invest in broad stocks as wel as commodities in our Momentum Investing portfolio. In our Trade Alerts premium service we focus on SPX trading in the short term. Next to SPX trading we take a few swing trades per year. In 2020 the combined portfolio delivered +93%. Results are tracked in our trade log books, and publicly shared every 6 months on our Mission 2026 page.


