
In our 15 leading indicators we analyze the monthly charts of 15 assets. All combined we get a clear picture on the dominant trend of global markets across asset classes (equities, commodities, currencies, treasuries). What do we conclude in this month’s update when it comes to the dominant trend of global markets? Does this favor our top 5 stock forecasts?
Identifying the dominant market trend is of course the single most important thing to do for any investor. That’s because of the top down approach that is the basis for success: on the highest level (asset classes) we determine what looks bullish, and on a lower level (individual stocks or markets) we take positions.
As per our 100 investing tips we apply intermarket analysis to forecast dominant trends. What is intermarket analysis?
Markets move in relation to each other, they do not move in a vacuum. Capital flows from one market to another market, considering that cash is also a market (any currency). This flow of capital can be identified by thoroughly analyzing chart patterns and trends in a handful of leading assets. They are primarily treasuries, currencies, leading stock market indices, gold, crude oil.
Currencies and credit markets are the most important assets to watch. Not necessarily to take positions, but primarily in determining the dominant trend. Any major turning point in markets was preceded by the start of big move in credit and/or currency markets.
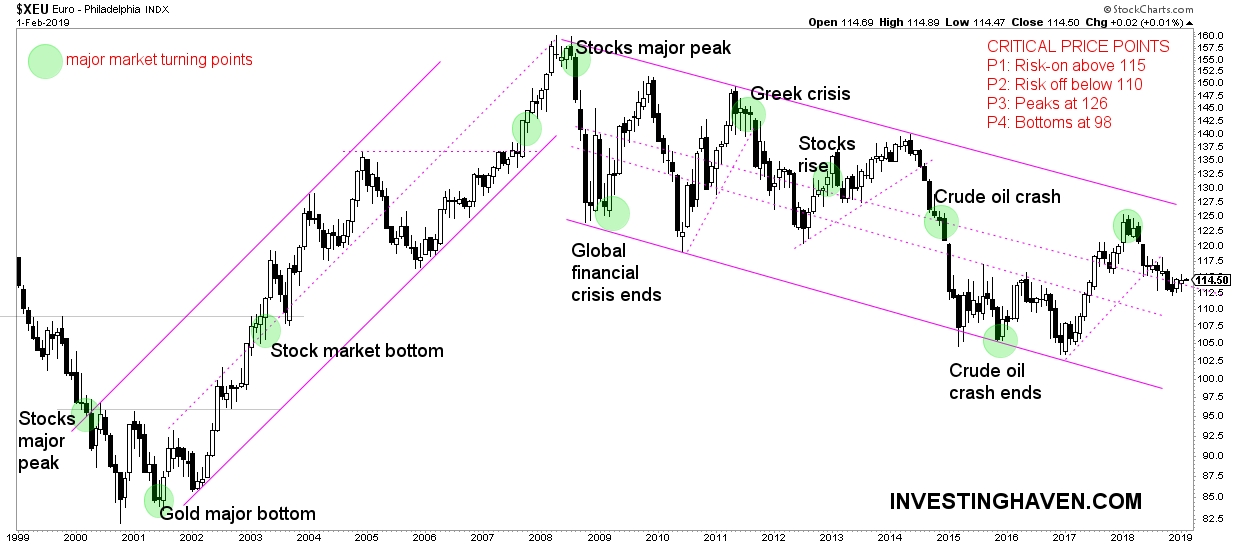
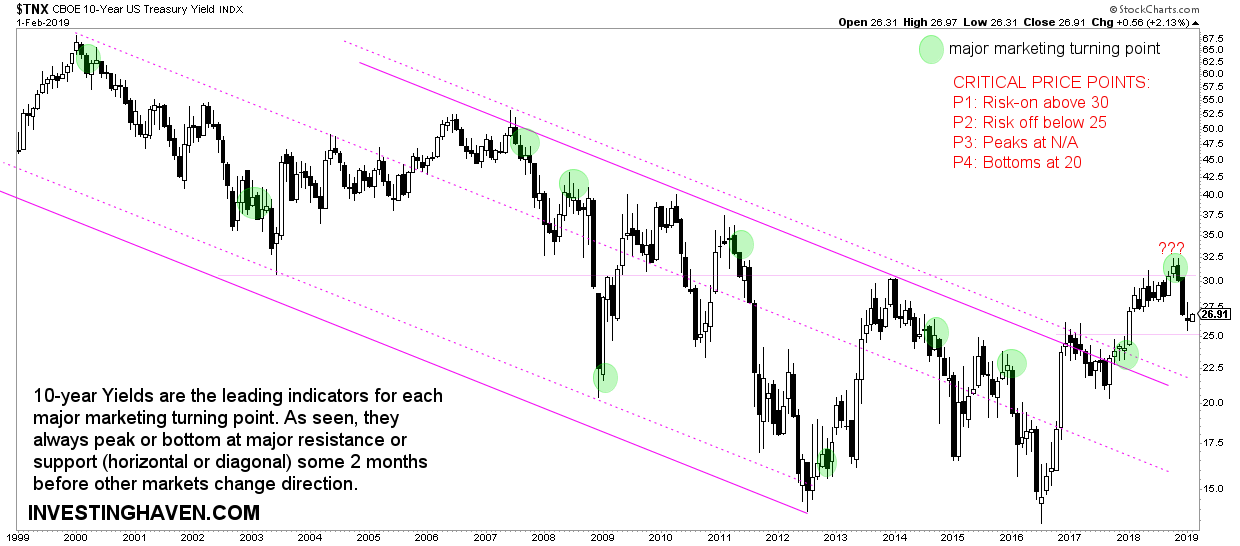
In terms of currencies we closely watch the Euro for a risk-on signal once it trades above 115. It should certainly not fall below 110. Moreover, 10 year Treasuries below 2.50 would signal a strong risk-off trend, and 20-year Treasuries above 125 for risk-off.
What does the Euro chart signal for global markets? Benefit of the doubt to the risk-on bulls, so no real threat for risk assets like stocks.
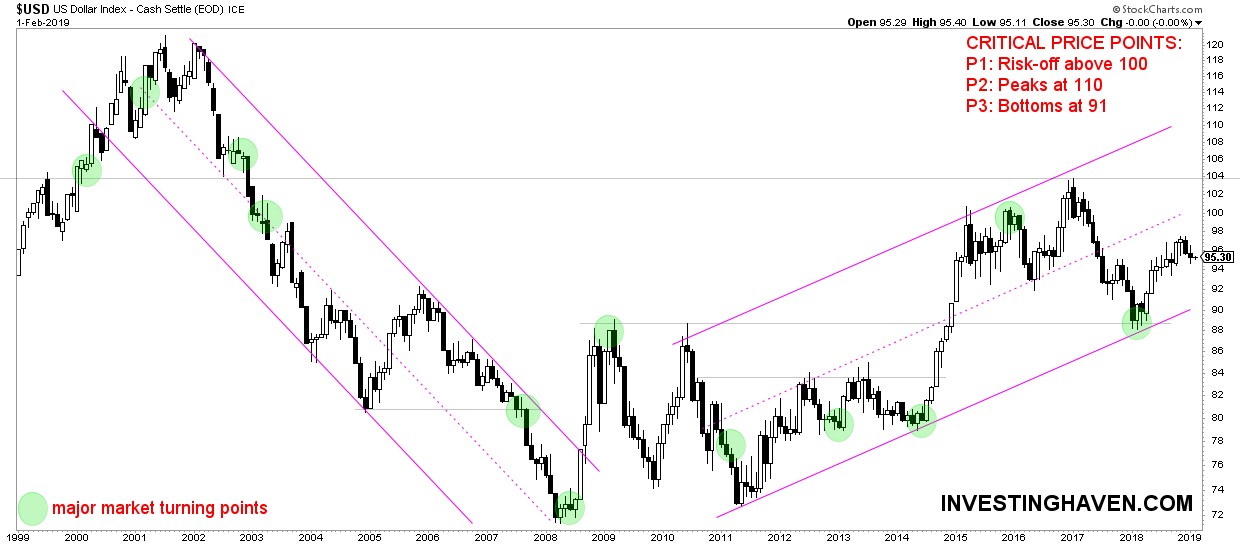
What does the US Dollar chart signal for global markets? The USD looks tired now and might fall back to support at 90 points which would be great news for risk assets like stocks but also commodities especially precious metals.
What does the 10 year yield chart signal for global markets? 10-year Yields are in a twilight zone area. Below 25 nasty, above 30 favoring stocks.
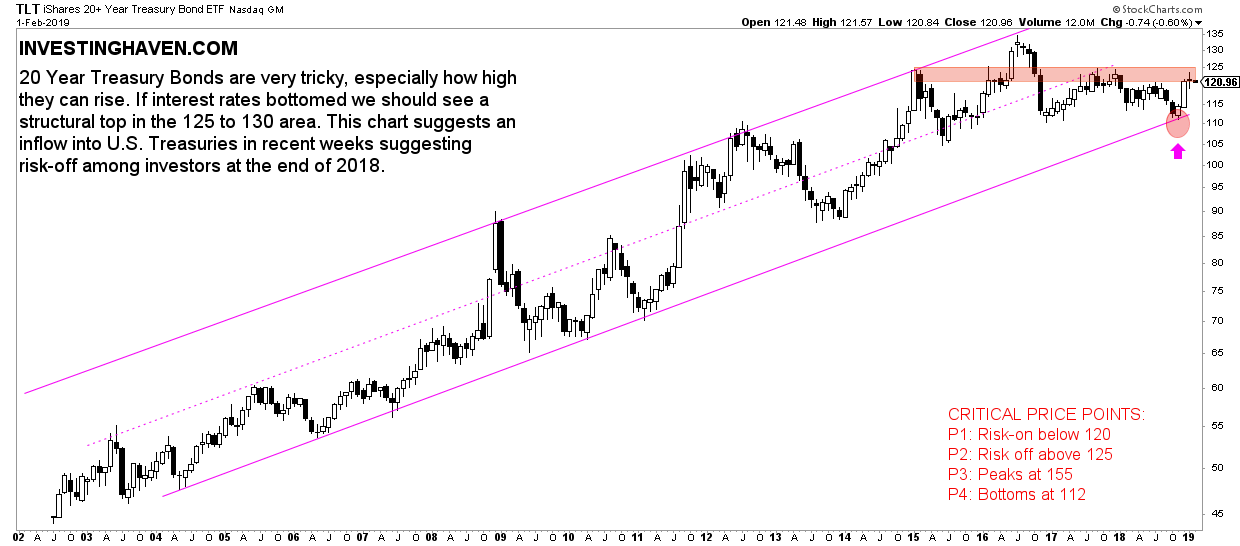
What does the 20 year bond chart signal for global markets? 20-year Treasuries stopped rising at major support. The million dollar question is what’s next. We are at a major decision point. Note the small area between support at 113 and resistance at 120. With every passing month there is one point that the support line is rising, one month ago it came in at 112 and now (early Feb 2019) is sits at 113. Something major is about to happen in the next few months, first part of 2019!
What does the Russell 2000 chart signal for global markets? The Russell 2000 (RUT) is, by far, the most important leading indicator among U.S. stock indices. It has always forecasted major trend changes in the form of major tops or bottoms.
Good news as February 2019 kicks off: major support was respected, and we are way above support now. Just a little bit more work is needed before we get back to the intermediate resistance area. For now, benefit of the doubt for the stock bulls.
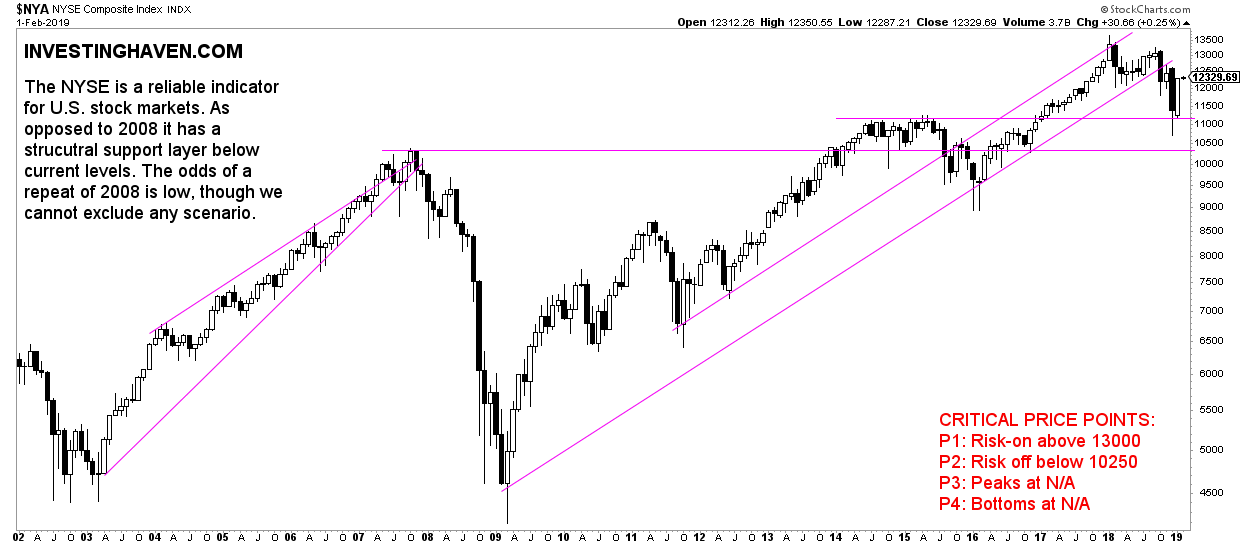
What does the NYSE breadth indicator signal for global markets? Below is the only market breadth indicator we have included in our set of 15 leading indicators. The NYSE composite index internals was at deeply oversold levels, is what we said one month ago. It was a logic place for a recovery. That’s what happened.
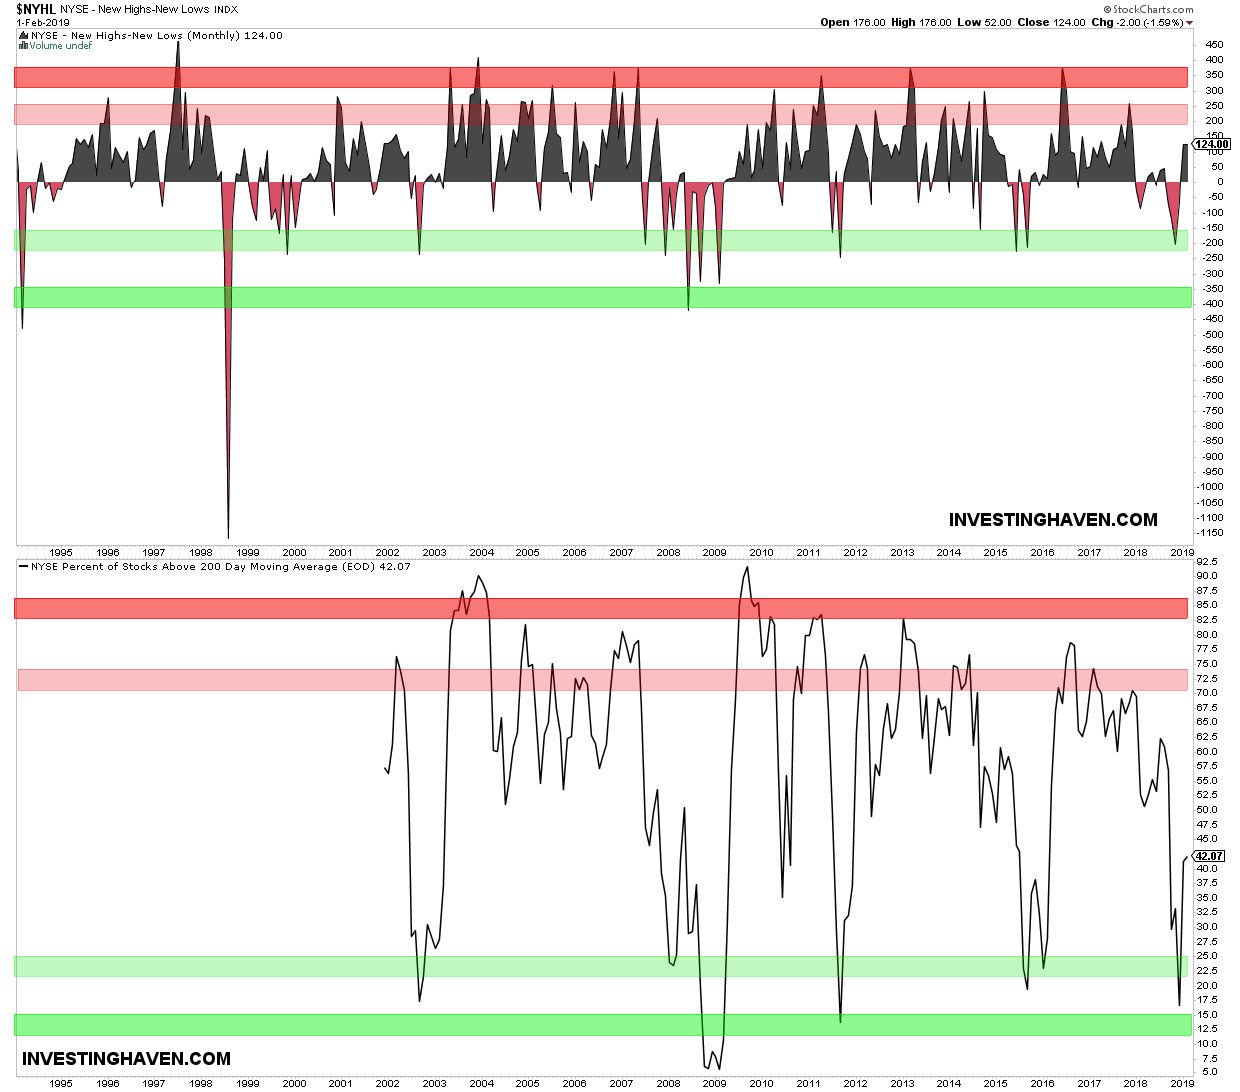
Similarly, for the new highs minus new lows indicator (top part of this chart) we saw a recovery from the -200 area (light green). We look at this breadth indicator in conjunction with falling Yields (10-year below 25). Both confirm each other: benefit of the doubt to the stock bulls, just a bit more work is needed to be in a safe zone, the recovery from strong support in Jan was great!
In sum, this trend is so far not contradicting our individual stock forecasts for 2019.


