The global stock market index (GDOW) continues to trade at a critical level. The U.S. stock market leading indicator Russell 2000 (RUT) has a more constructive though somehow similar setup. The setups do not look like there is a giant stock market crash coming. This has the looking of a consolidation with a bullish outcome sooner or later.
Let’s review 2 charts in this article: the Global Dow Index representing global stock markets as well as the Russell 2000 which is our leading indicator for U.S. stock markets.
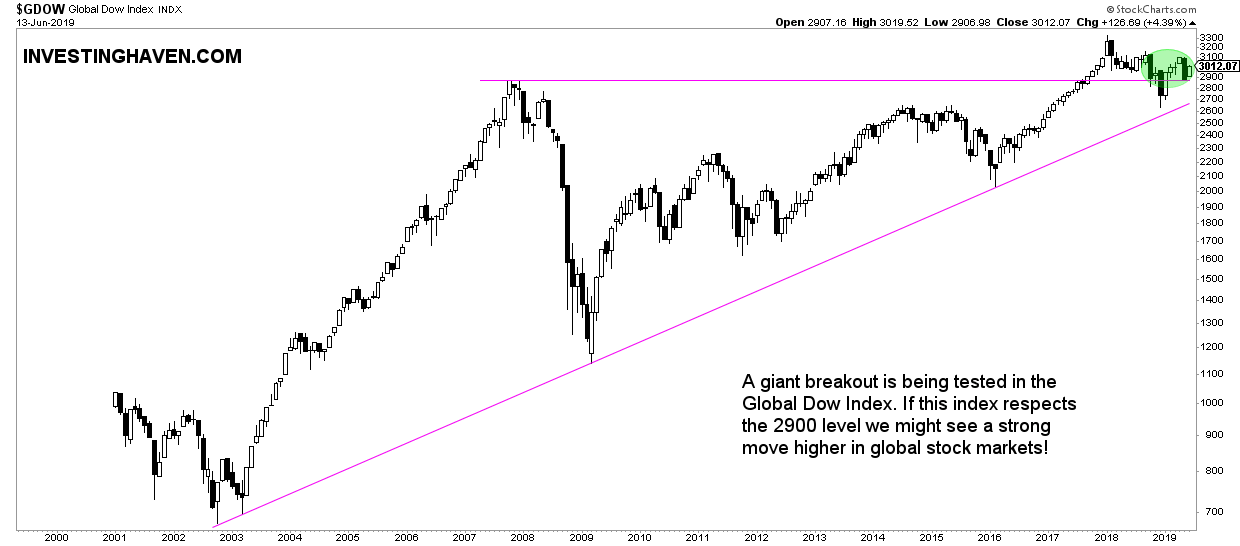
The Global Dow Index GDOW monthly chart over 20 years is the first chart shown below.
The setup is pretty straightforward: a giant breakout pattern that started in January of 2018, with a backtest early 2019 and a continuation of the breakout in recent months.
Admittedly, this is not yet a solid pattern that invites investors to jump on the stock market bandwagon. However, it does not look bad neither. As long as the GDOW trades in the area highlighted in green we can be sure it will have a bullish outcome.
The ‘counter argument’ for the bullish outcome is the continuous concerning stock market news. Growth concerns, trade wars, unemployment data, falling rates, and so on and so forth. The list is endless.
Our point of view is simple: the more obvious the concerns, the lower the probability that they will impact stock market prices. If ‘everyone’ is convinced that a market will move in a certain direction you can be sure the opposite will happen, as per our 100 investing tips.
Think of the 2007 peak: who said a crash would follow? There was peak optimism.
Similarly, in December 2018 there was a consensus that the situation would become worse because of a gazillion of concerns. What happened? The opposite!
If things were so easy in markets and investing every investor would be a millionaire! The sad truth is that a minority of investors are really successful.
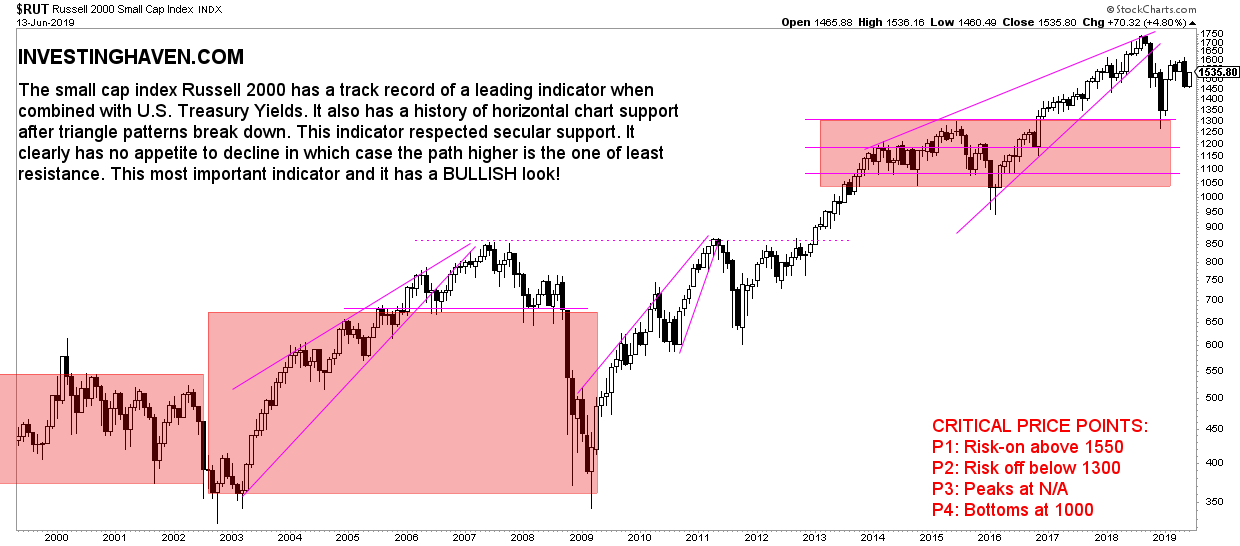
If we continue with our chart analysis we see a somhow similar picture in the U.S., though with a small ‘twist’ compared to the GDOW.
The Russell 2000 which is our leading indicator also broke out but did so early in 2017. It spent the last months of 2018 testing its breakout point. Right now, it trades halfway between breakout point and all-time highs.
We believe that the worst in the interest rate crash is over. Consequently, if that’s true, it means that volatility will slowly but surely disappear. If that’s true it will open the gate for bullish energy to return into stock markets.