Hardly anyone can escape the stock market crash fear. It is everywhere especially on the internet. That’s why we always warn to stay factual, and master emotions when investing. It is a solid chart based method that will not only help neutralize fear but it will also help predict future trends. This article focuses on the question how to predict whether market turmoil is underway.
As an illustration of how easy it is to get caught up on the ‘stock market crash’ saga below is a subset of crash articles that appeared in the last week:
- ‘Obscenely overvalued’: Stocks are far more fragile than most people realize — and one expert says traders are making the same mistake they did before the last 2 crashes (Business Insider)
- BMO Warns US Stock Market Could Crash to ‘Ugly’ December Lows (CCN)
- Protect Your Retirement Against Stock Market Crashes (Forbes)
- 1929 Stock Market Crash: Did Panicked Investors Really Jump From Windows? (History.com)
- 10 years ago this week, the market hit the climactic bottom of the Great Recession (CNBC)
Scary, right?
That’s the problem. Fear is so misleading.
The antitode against fear is a chartlist with the right charts as per a method that has stood the test of time.
How To Predict Whether A Stock Market Crash Is Underway
InvestingHaven’s method looks at important market turning points based on this principle, and we said so in our investing tips for successful investors:
All major moves in markets, especially market crashes, start with major turning points in credit and currency markets. That’s why 10 and 20 year rates, as well as leading currency pairs, have the most influence on all other markets, including stock markets around the globe.
Below we revise the most important currency and credit market indicators: the 10-year Yield chart as well as the Euro chart. We also explain how to read those charts when attempting to forecast a stock market crash!
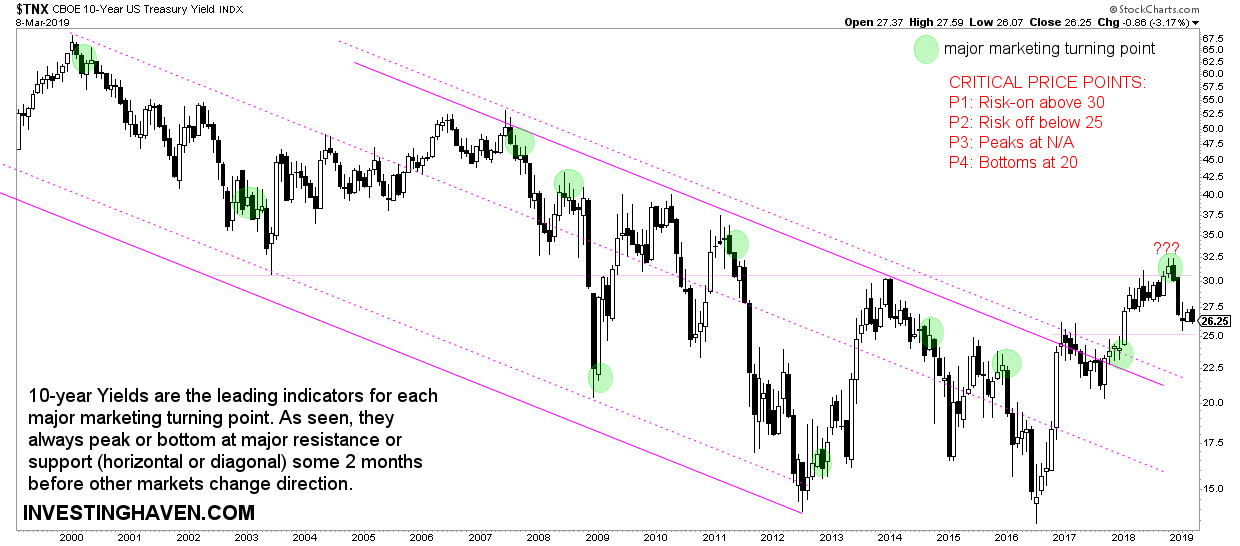
10-year yields
What we are looking for as a major red flag is a fast decline of yields when breaking an important chart pattern. For instance, moving very fast below 22.5 points, the upper line of the falling channel.
The joker on this chart is the recent breakout above the channel. This may suggest that we entered a new era in the bond and yield market.
Between 25 and 30 points this indicator is neutral, and does not forecast any turmoil.
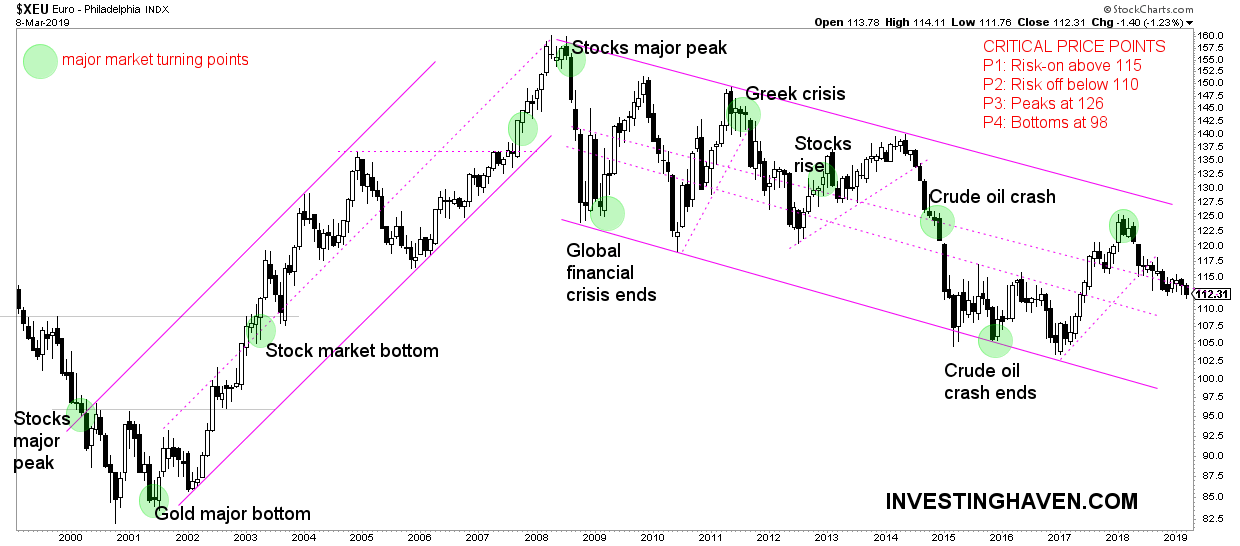
The Euro
The most important currency chart is the Euro. It should be read together with the yields, see above.
The Euro chart, similarly, should show an acceleration of a decline when breaking down through an important price level or after touching secular resistance. None of this is happening right now, which does not mean it cannot happen in the future.
For now, no early sign of a stock market crash whatsoever.
A soft decline to the support area in the 105 to 110 level is not a problem, a very fast decline would be a different story.
How does this influence stock markets?
The whole point about our intermarket methodology is that leading indicators in the currency and credit markets should be read together with important chart pattern changes in stocks, commodities or inflation readings.
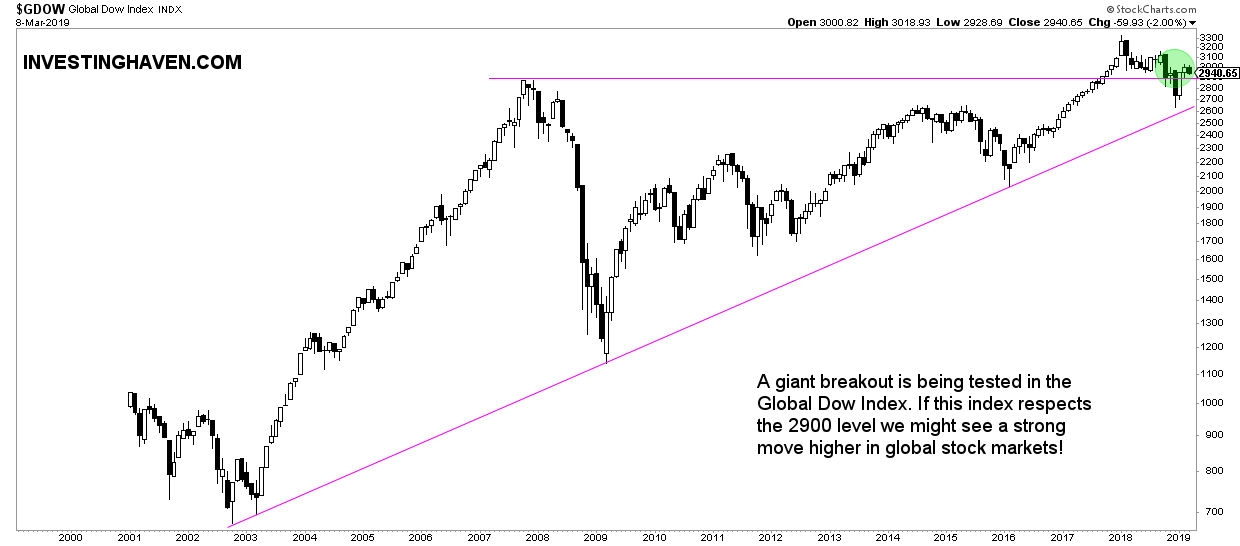
Let’s take the global Dow as an example. This instrument is testing a major breakout. Assume this will fall through its triangle, below 2650 points in conjunction with fast falling yields and Euro, it would forecast serious trouble ahead.
None of this is happening right now. No signs of a stock market crash coming!
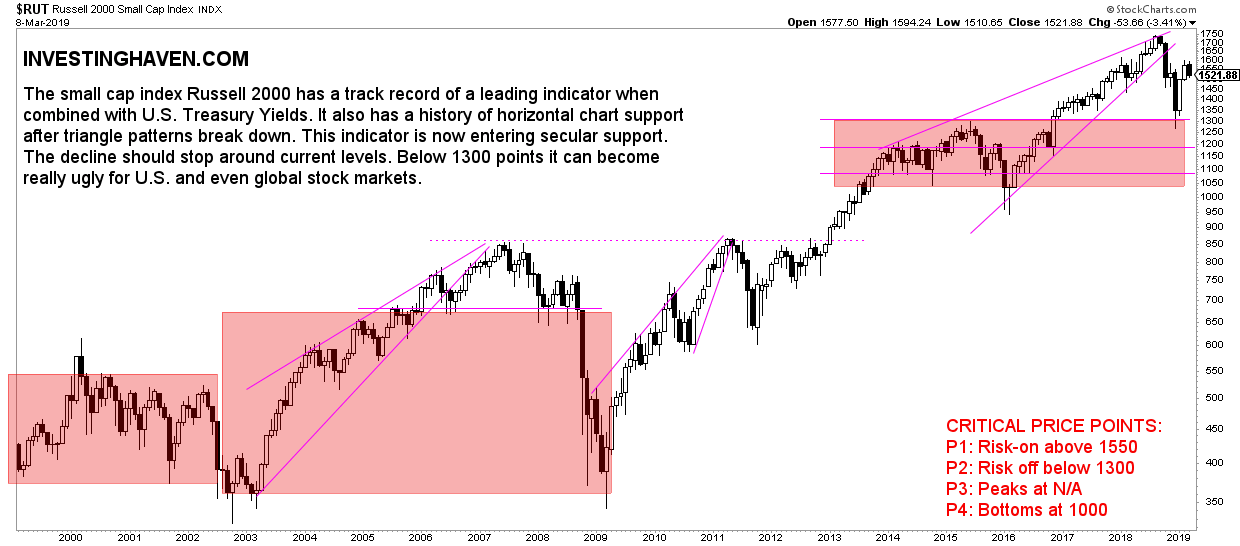
Similarly, if the Russell 2000, our leading indicator for U.S. stock markets, falls below 1300 points after the Euro and 10-year yields are decling fast with a breakdown on their chart, it would forecast a stock market crash is underway!
Again, nothing like that is visible in the chart today.