
Inflation is the topic of the month. And everyone has a different view on inflation. Good luck sorting it out. At InvestingHaven we stick to this mantra: if it’s not in the charts, it’s not there. Here is another one: most financial media are designed to sell story telling. And lastly: keep things stupid and simple. Here are 4 simple charts that show is the inflation that’s not there, at this point in time.
Wait wait wait, is what astute readers are going to say. Here is CPI, and inflation index a, inflation indicator b, and inflation point c. They are prove that inflation is here.
While we don’t disagree that there are inflationary data points that suggest inflation is in the system we are saying something entirely different.
What we are saying is that all that matters for investors is what’s in the charts of financial markets. Because that’s the playground in which we invest.
While fundamental and foundational indicators may tell there is inflation in the system, there is more inflation on the horizon, and so much more, it is all pointless if there is inflation in the short to medium term in the instruments in which we invest.
Long term, we have no doubts that monetary policies will create runaway inflation at a certain point in time. That’s not now, and it’s pointless to design and define theories about a future state. We can come up with 50 variants, and all it will do is (a) confuse us (b) give us some headache, for free (c) deviate from finding the right positions in which we need to be invested now and in the foreseeable future.
That said, we look at 4 charts from the decade 2001-2010, an inflationary period in key asset classes in which we could (can) invest, to make the point.
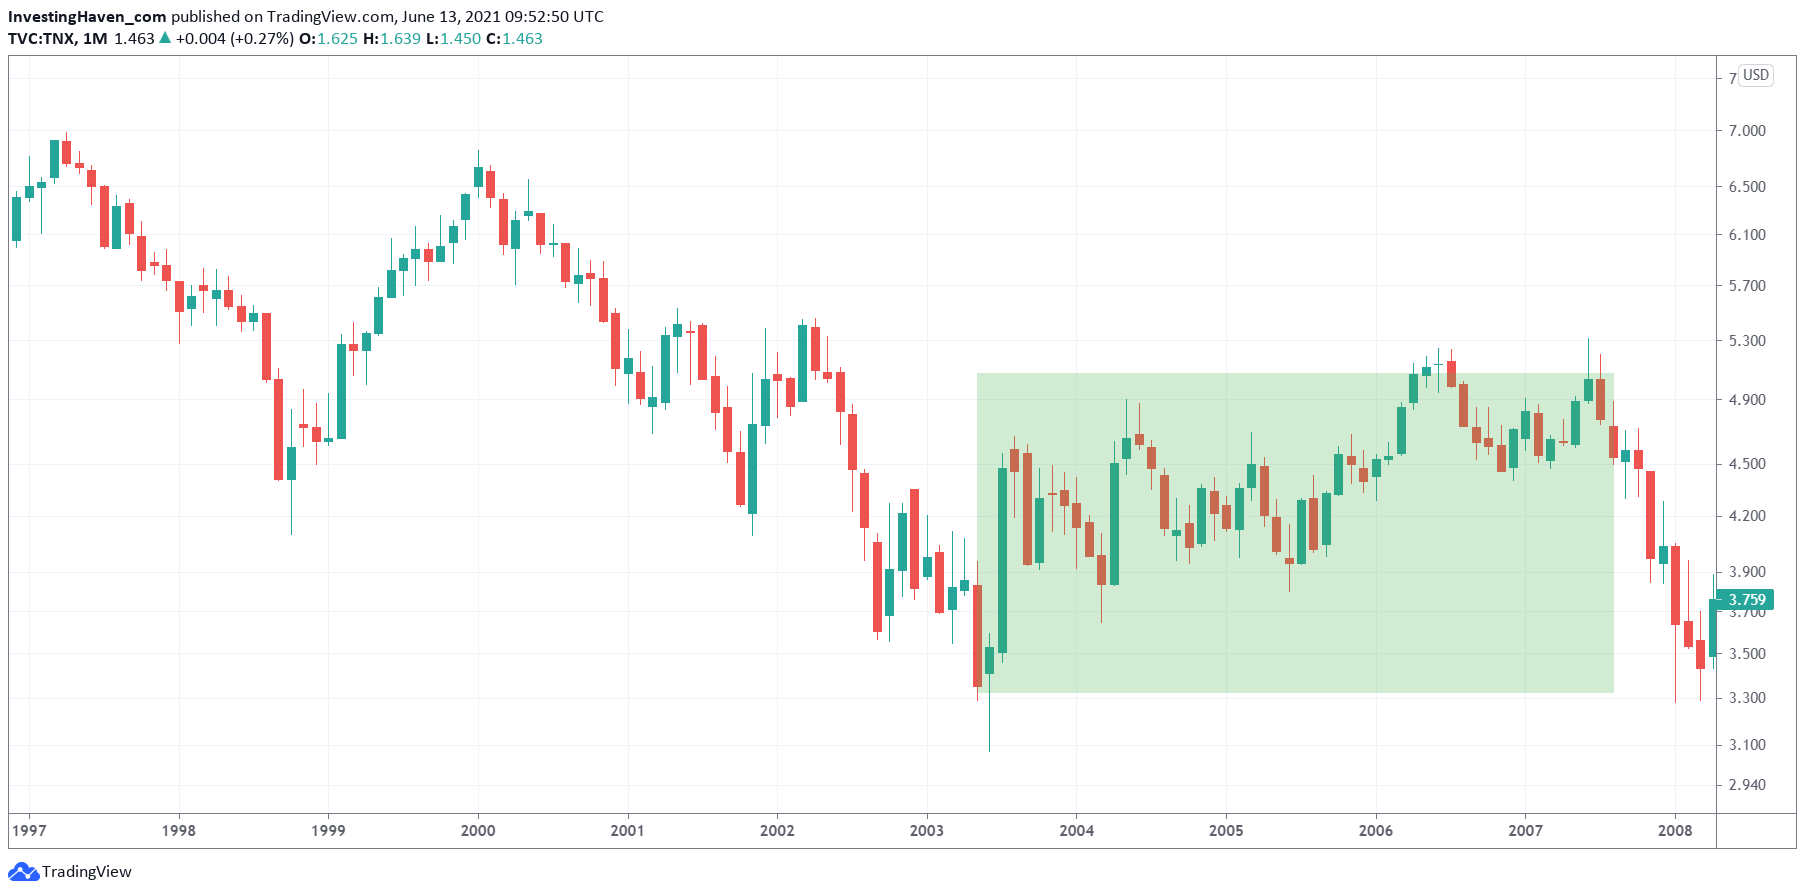
Bond yields were flat back then. We can’t have falling bond yields to support inflation. Right now, bond yields are flat to bearish, in the short to medium term. They will likely rise longer term.
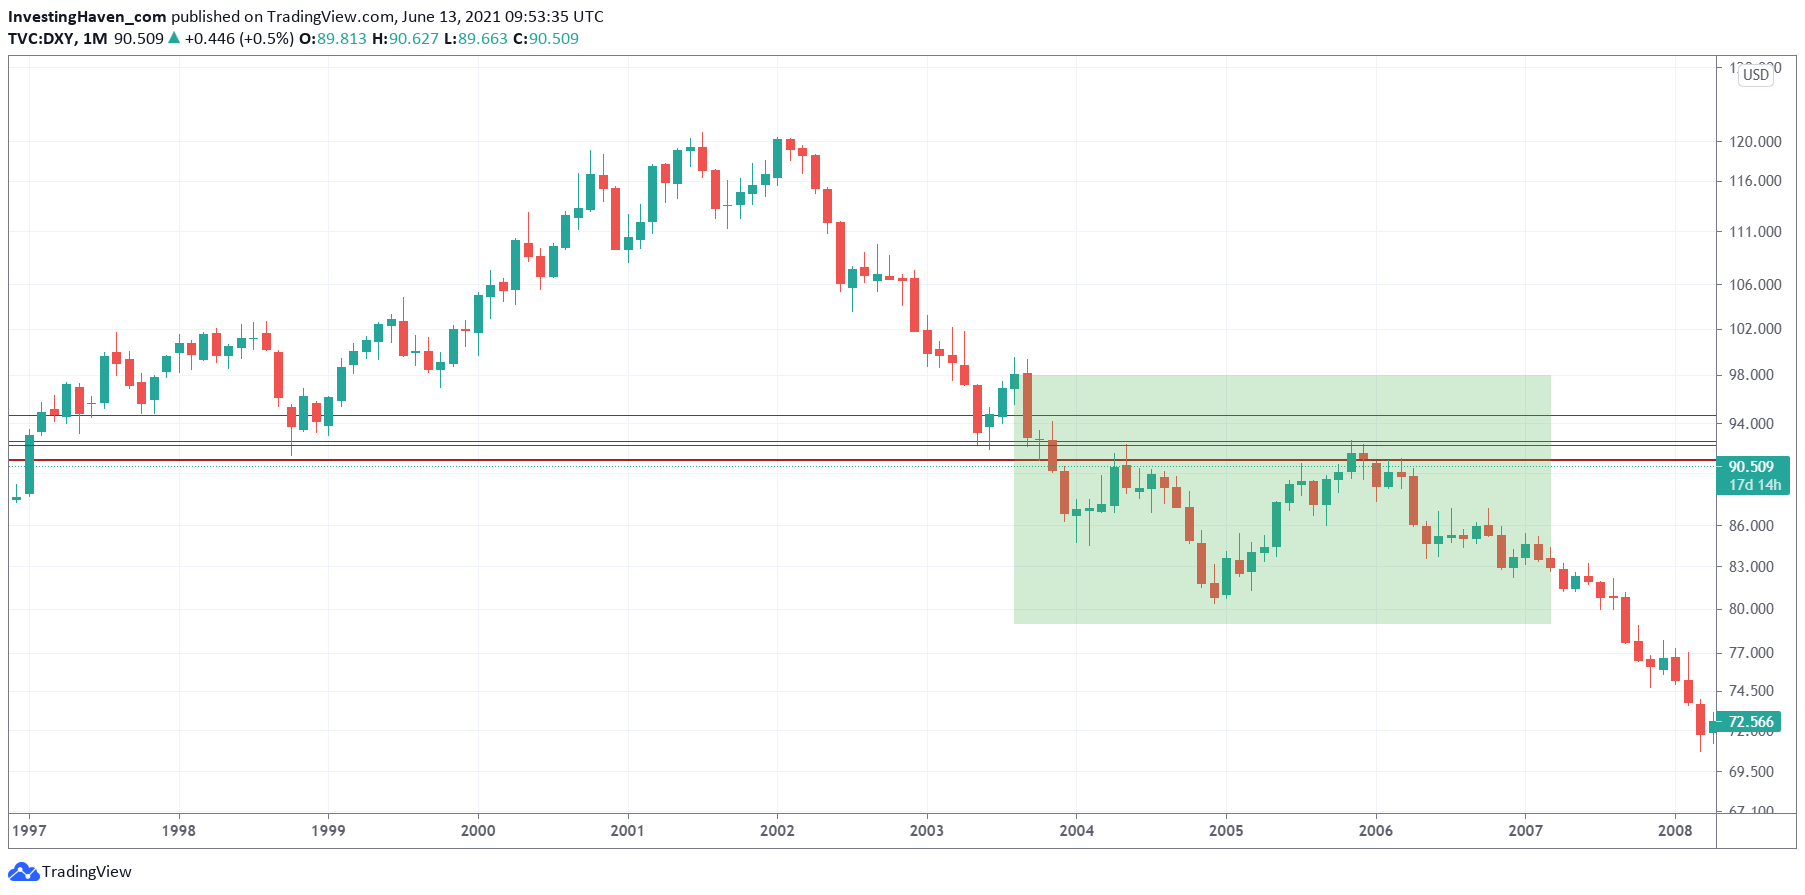
The USD was weak back then, the USD is building a base right now. We need the USD to hit resistance at 94 points in order to have inflationary effects on investable assets. Not clear if the USD will continue to be weak, for now it has found a floor at 89 points, and it looks like a solid floor… for now.
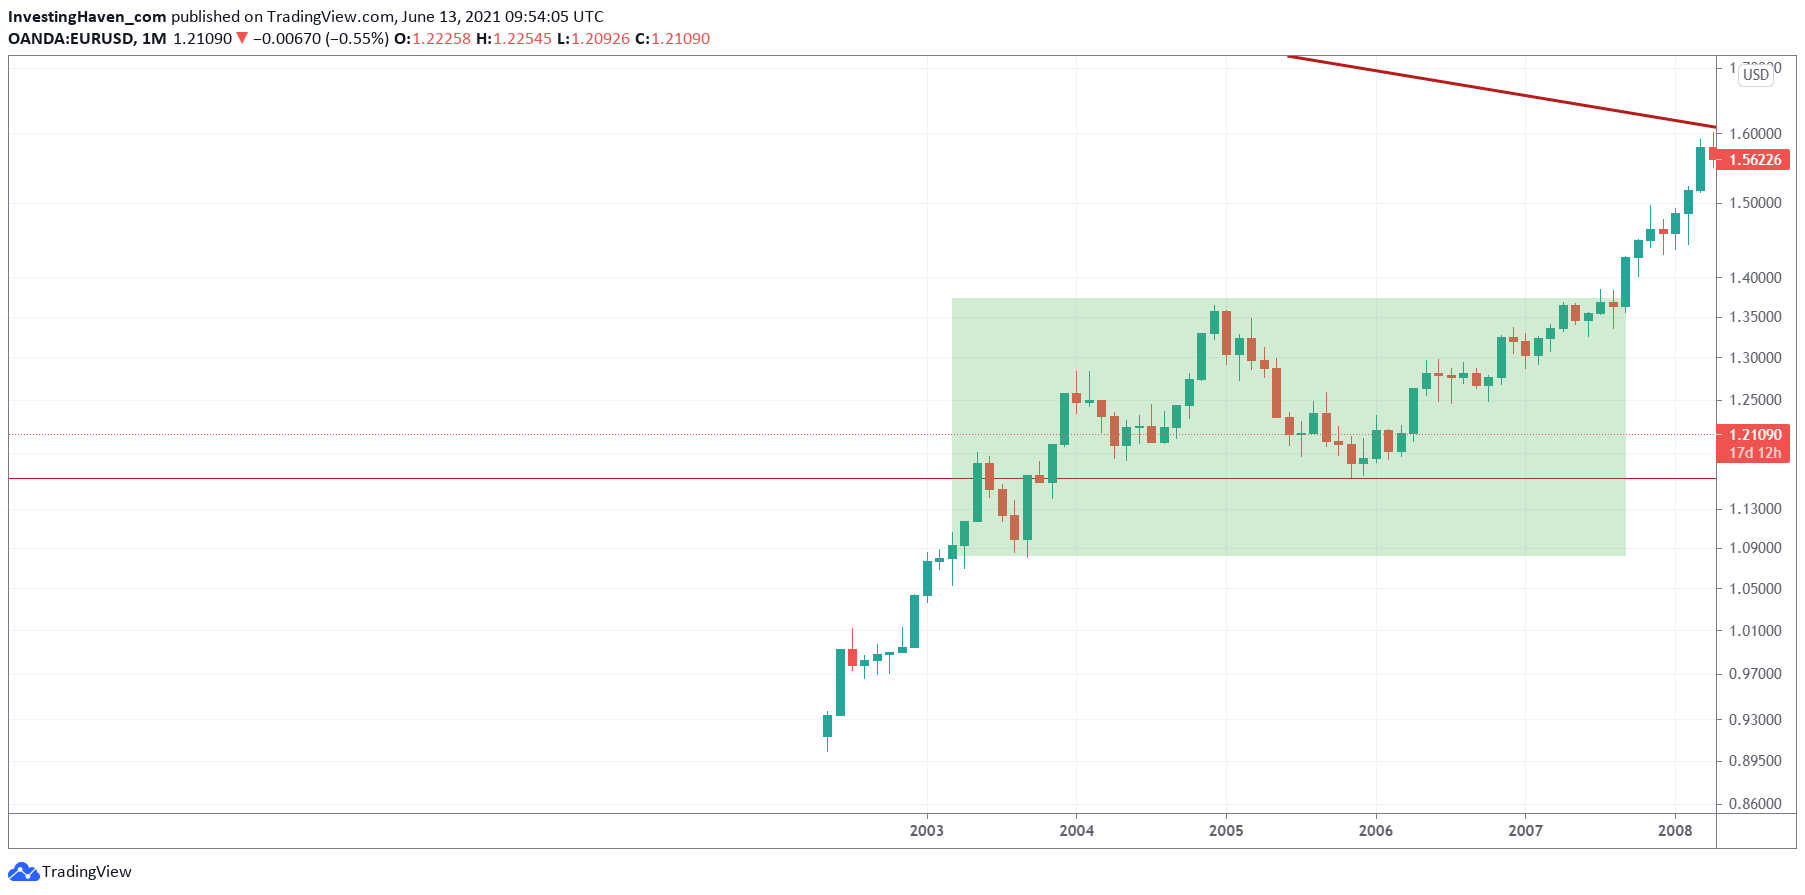
The Euro has to be bullish in order to create inflationary pressure on investable assets. Right now, the Euro might be confirming a secular breakout but we need a few more months in order to confirm this. No runaway inflation in the short to medium term, says the Euro chart.
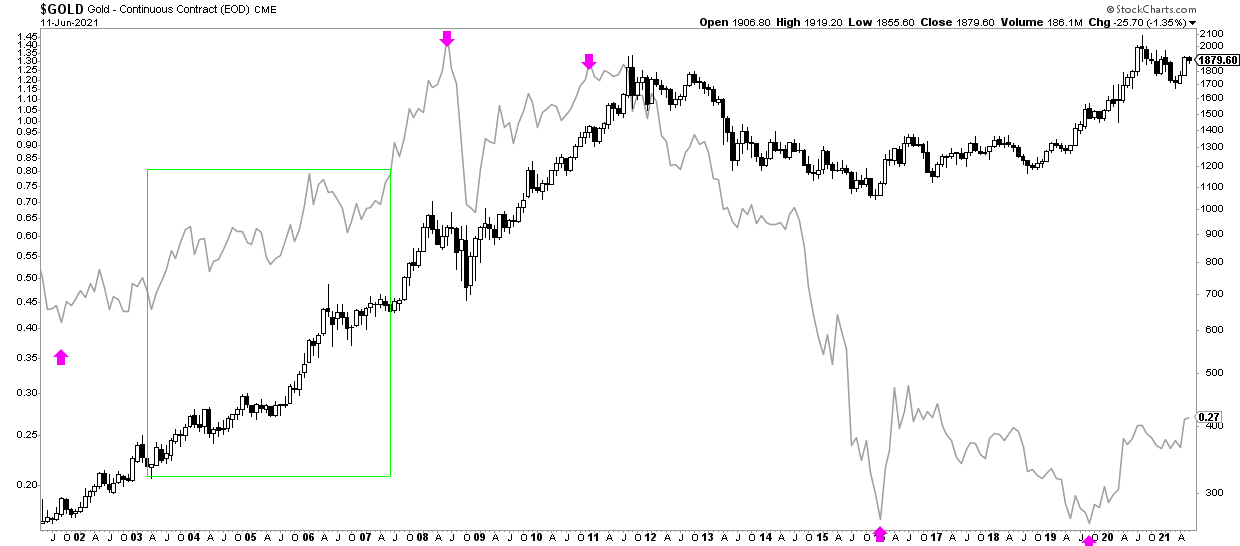
The correlation between gold (dark line) and the inflation/deflation indicator of Martin Pring (light grey line) showed a strong positive correlation and a rise, back in 2003-2008. Right now, there are strong signs to believe that this is about to repeat. Not there yet, needs a bit more time.
While the above historic charts and the comparison with the current state of the charts (not included in this article, but easy to verify) suggest that inflationary effects in investable assets may be underway, it’s not there yet. Short to medium term, we should focus on other opportunities. Yes, we can plan for the future, but we can’t position as of yet. Fundamentals are the worst timing indicator imaginable.
In our Momentum Investing portfolio we are focused on the super cycle in metals which is an opportunity that’s here, right here right now. In our Trade Alerts portfolio we are preparing an auto-trading service which will allow our members to create a passive income stream.


