Last weekend we spotted a powerful bearish setup: bearish stocks, bullish crash indicators VIX and USD. A few days later, the bearish setup was entirely invalidated. We went back 16 years in time to find similar setups, and we were astonished by our own findings: the bearish damage that similar bearish setups produced in the last 16 years was on average a 12% decline in the S&P 500. Last week the same setup entirely invalidated in 3 trading days. This, officially, qualifies as the weakest sell-off in history on an extremely bearish setup. Conclusion that leads to this market forecast: this stock bull market is extremely powerful, and 2021 will be a very bullish year for stocks. This is a data driven, fact based conclusion, not our opinion. We expect the market to crush our Dow Jones Forecast for 2021.
From our update last weekend It’s Official: Dow Jones Correction Started on January 27th, 2021:
We use our standard practice which we call ‘crash indicator analysis’ to understand downside potential and pressure for stock markets. This is a framework of leading indicators that push stocks lower. And the trick is to understand which of those leading ‘crash’ indicators (don’t take the word ‘crash’ too literally) is dominant.
We report on this in our weekend updates to premium members. Last weekend, we wrote Why February Might Be Ugly, When We Will Know And How We’ll Handle It (Jan 24th, 2021)
And we learned in the Corona crash year to stay focused on our crash indicators to try to understand when weakness shows up. In the end the Corona crash was visible in one chart, very much hidden, only visible for those that have an advanced crash indicator analysis method.
We already can see that two of our crash indicators will give us an answer THIS WEEK. Both have a short to medium term impact, and one of the two is the ‘xyz’ chart.
We will know, later this week, whether we expect February to start on a bullish or bearish note, suggesting that scenarios 2 or 3 of the ones outlined above are playing out.
Source: premium research Momentum Investing by InvestingHaven
Fast forward, one week later, and the bearish setup was entirely invalidated already last Wednesday.
It’s very simple: either our market readings were inaccurate, or the bullish power underlying this stock market is extremely powerful. Or both.
In order to ensure that we did our homework well we went back and checked all our chart readings. They were accurate, for sure.
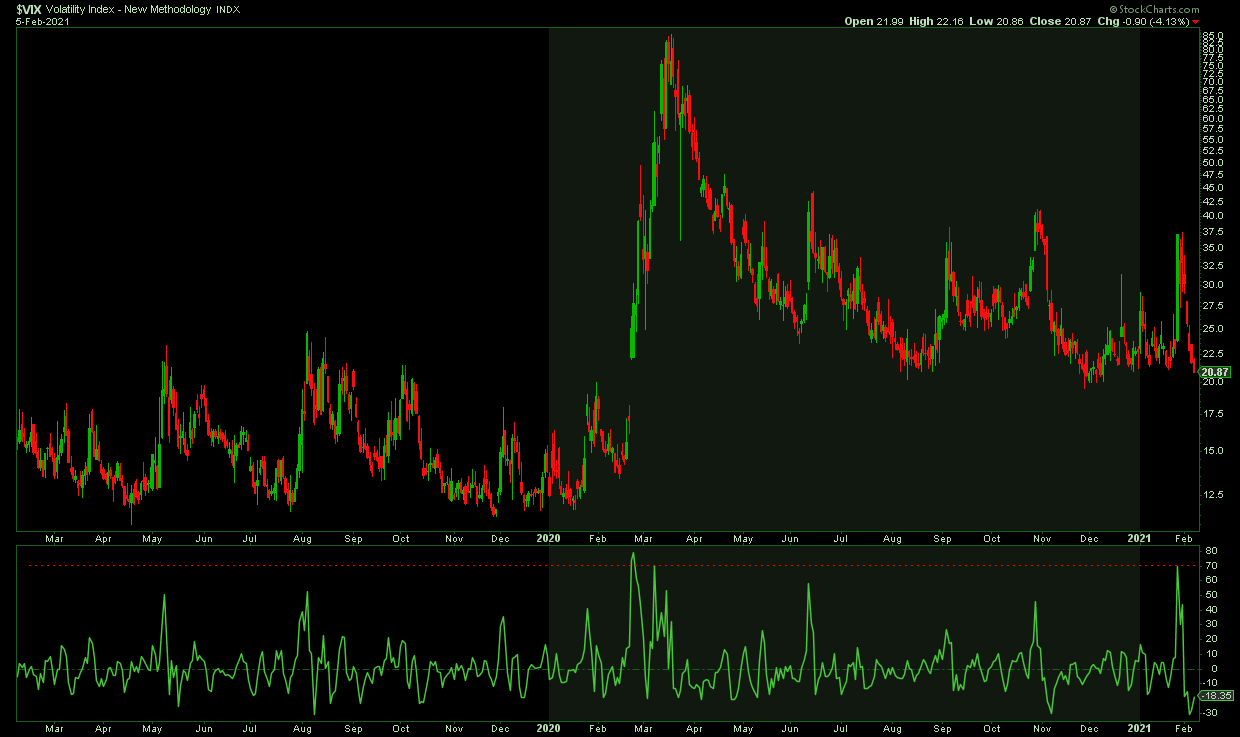
So we went on to find out how powerful this ongoing stock bull market is. And we researched this question: how many times did VIX push at least 70% higher in 3 trading days, and what was the damage to the S&P 500 index?
Our findings were astonishing:
- Only 5 instances in the last few decades pushed VIX +70% higher in 3 trading days.
- In all those instances, the damage on SPX ranged from 9.7% to 19.5% in 3 to 4 trading days. The average drop was 12.5% in SPX.
- In all those instances the recovery was slow, and mostly indexes went lower for an extended period of time before moving higher.
- Even during the 2008/9 crash there wasn’t such a violent move in VIX.
- Last week, the SPX impact was a laughable 4.3%, and 4 days later SPX was trading higher than where it started ‘dropping’.
Below is the VIX chart from 2019 till today, and the VIX ‘rate of change’ is featured in the lower pane. We can clearly observe the explosiveness of VIX was in the last week of January. What was the ‘damage’ that it created to SPX? The SPX index dropped from 3869 to 3695 points, a 4.3% drop, and 4 trading days later SPX hit new highs at 3872.
We are having a hard time believing a 30% market crash will occur, as per this news item.
This finding really has an important message for us: we better adjust our methodologies to support very bullish conditions. And that’s what we did lately: adjust our Trade Alerts methodology to ensure we get the maximum out of rather unusually strong bullish market conditions. Moreover, in our Momentum Investing portfolio, we adjust stock selection and duration to align to the current conditions. We’ll show the results in a few months in both our portfolios on how effective these adjustments will prove to be.