Investing Haven
No Result
View All Result
Gold Silver Investing >>
CRYPTO INVESTING >>
  • 2026 Forecasts
    • 10 market predictions
    • Dow Jones forecast
    • S&P 500 forecast 2026
    • Nasdaq prediction 2026
    • Best altcoins to buy in 2026
    • Best crypto to buy now
    • Which crypto will explode
    • 15 crypto forecasts 2026
    • Which precious metal to buy
  • Silver
    • Silver prediction 2026 – 2031
    • Can silver hit $100?
    • Silver shortage
    • 50-year silver chart
    • Silver bullish reversal
    • Silver seasonality charts
    • How to invest in silver
  • Gold
    • Gold prediction 2026 – 2031
    • Will gold set new ATH?
    • Can gold hit $10,000?
    • Gold chart 10 years
    • Gold chart 50 years
    • Gold chart 100 years
    • Gold silver ratio
    • Gold seasonality charts
  • Commodities
    • Coffee forecasts
    • Sugar forecasts
    • Nickel forecasts
    • Lithium investing
  • Crypto forecasts
    • BTC prediction 2026 – 2031
    • ETH prediction 2026 – 2031
    • SOL prediction 2026 – 2031
    • XRP prediction 2026 – 2031
    • XLM prediction 2026 – 2031
    • BNB prediction 2026 – 2031
    • ADA prediction 2026 – 2031
    • AVAX prediction 2026 – 2031
    • KAS prediction 2026 – 2031
    • NEAR prediction 2026 – 2031
    • BCH prediction 2026 – 2031
    • LINK prediction 2026 – 2031
    • DOT prediction 2026 – 2031
    • SUI prediction 2026 – 2031
    • ICP prediction 2026 – 2031
    • LTC prediction 2026 – 2031
    • STX prediction 2026 – 2031
    • DOGE prediction 2026 – 2031
    • SHIB prediction 2026 – 2031
    • PEPE prediction 2026 – 2031
    • FLOKI prediction 2026 – 2031
    • WIF prediction 2026 – 2031
    • ONDO prediction 2026 – 2031
  • News
    • Crypto news
      • Bitcoin
      • Ethereum
      • XRP
      • Solana
      • Dogecoin
      • Cardano
      • Litecoin
    • Commodities
      • Gold
      • Silver
    • Markets & Stocks
    • Press Releases
  • Reviews
  • Login
Investing Haven
No Result
View All Result

Home » Markets & Stocks » It’s Official: Dow Jones Correction Started on January 27th, 2021

It’s Official: Dow Jones Correction Started on January 27th, 2021

Taki T. by Taki T.
July 3, 2024
in Markets & Stocks
Share on FacebookShare on Twitter

‘It begins’. The stock market is finally starting a healthy pullback. Not an outright crash like in March of last year, but certainly one that will hurt if you ignore it. Our bullish Dow Jones forecast 2021 is still in play, and part of our 2021 target is already achieved. We believe stocks will march higher in 2021, not as of yet though. Our short term forecast for February is bearish, later in 2021 our forecast is bullish for stocks. Our longer term 20 year Dow Jones chart helps with insights for long term investors.

The Dow Jones, not our leading indicator for stock markets but just an interesting chart to analyze, clearly confirmed that a retracement started.

The weekly chart helps us understand longer term trends. And it’s clear from the weekly Dow Jones chart that this index is about to drop to either of the 2 levels indicated on the chart. The first one is pretty obvious, the second one *might* be reached, not clear yet.

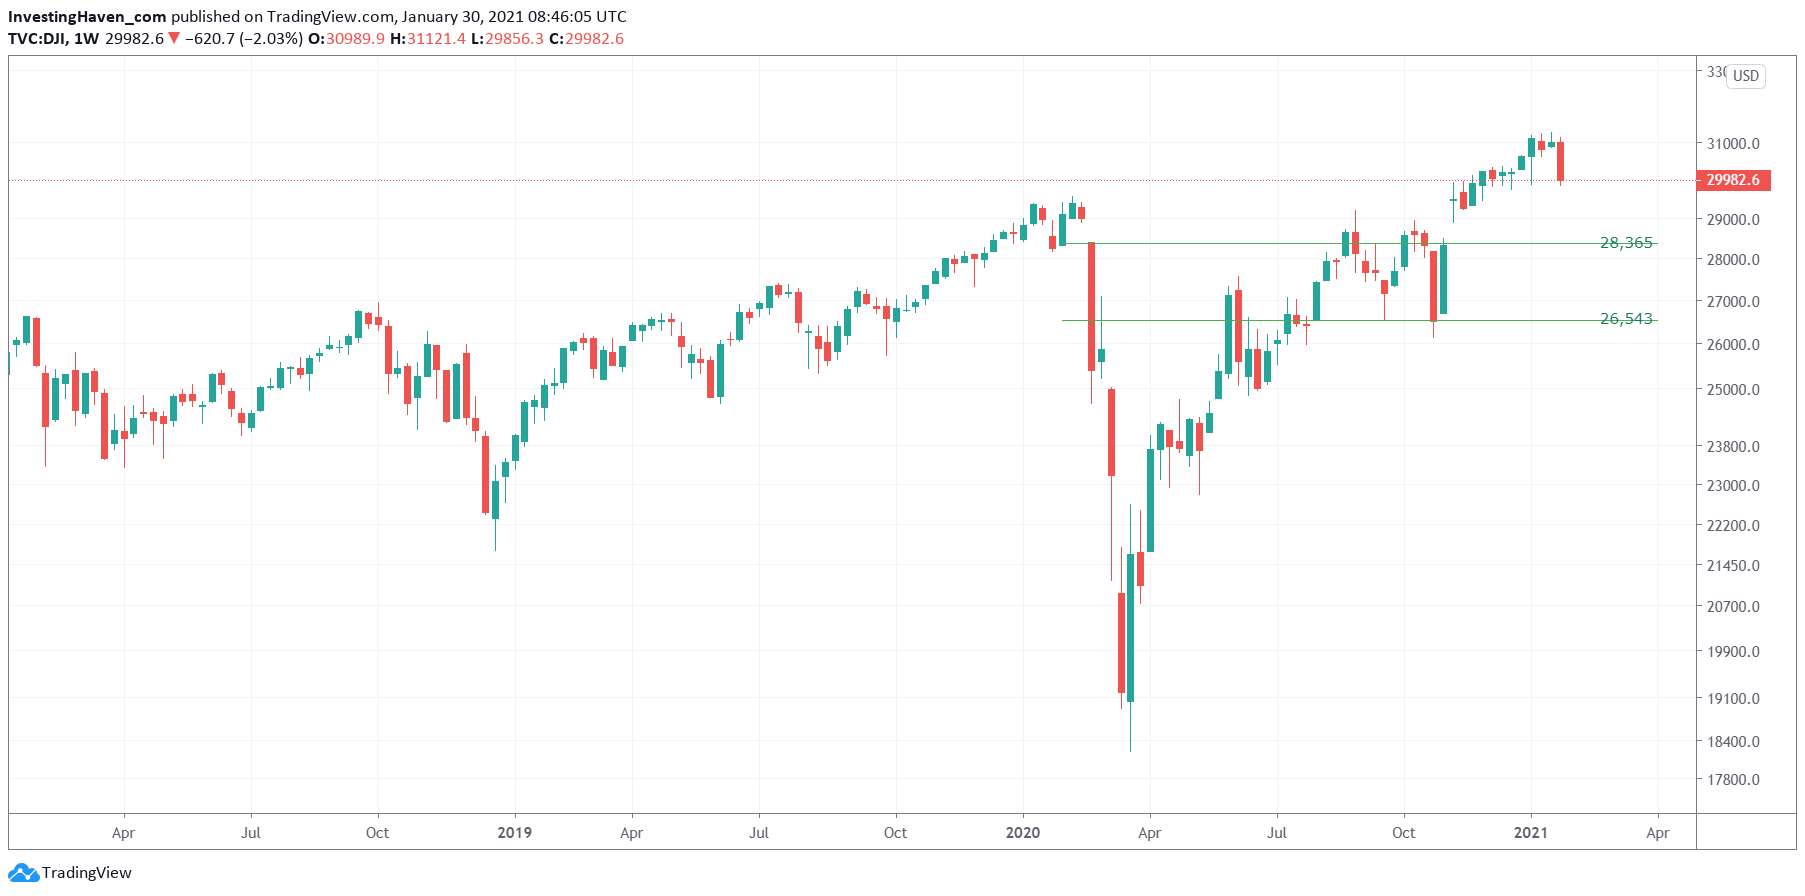
Note that the above chart makes it very clear: the last red weekly candle is much larger than the previous weekly candles. This marks the start of a retracement in stocks, and it will last at least 4 weeks.

But can we have more refined insights than just ‘it will last at least 4 weeks‘? Yes, and we offer them in our research service(s). Continue reading to get a sense of the refined insights that come of our research work.

The daily chart gives us a bit more insight into the exact target prices.

E.g., our first target for the Dow Jones is more of a range than an exact price. The 28.9k to 28.3k area is the one that this index is eyeing. The second level is pretty straightforward, it’s a price level and not an area: 26.5k.

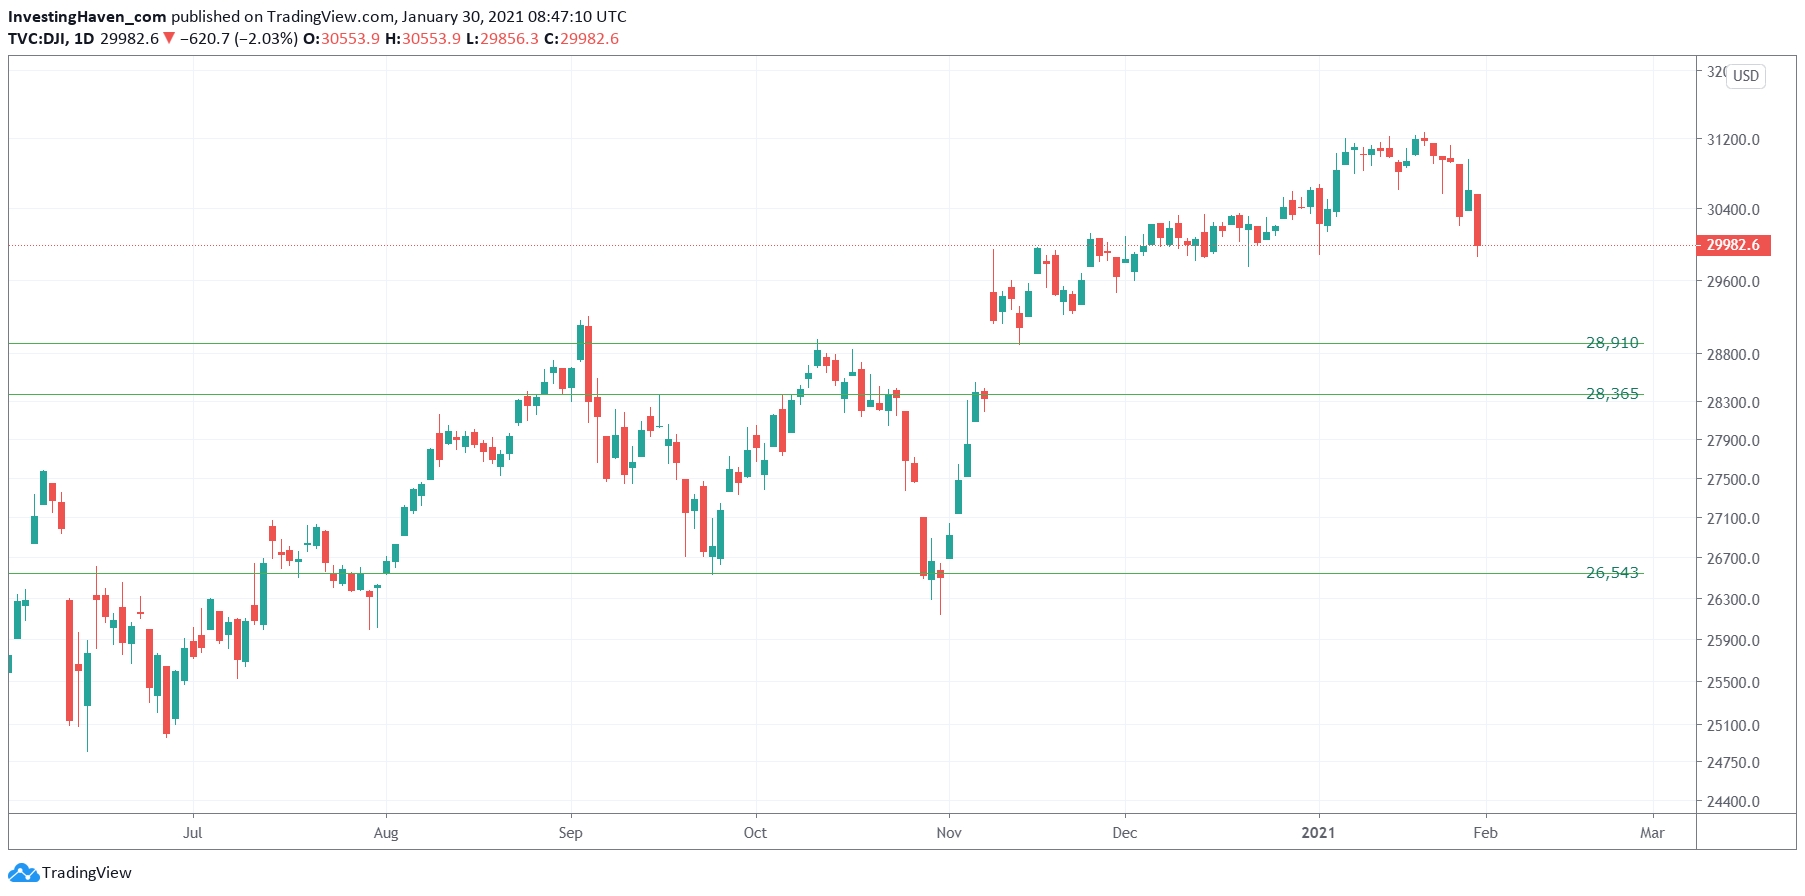
How will we know if the first or the 2nd level will be reached? In the end the difference between 26.5k and 28.3k is still 7.6% approx.

It’s very simple: we use our standard practice which we call ‘crash indicator analysis’ to understand downside potential and pressure for stock markets. This is a framework of leading indicators that push stocks lower. And the trick is to understand which of those leading ‘crash’ indicators (don’t take the word ‘crash’ too literally) is dominant.

We report on this in our weekend updates to premium members. Last weekend, we wrote Why February Might Be Ugly, When We Will Know And How We’ll Handle It (Jan 24th, 2021)

And we learned in the Corona crash year to stay focused on our crash indicators to try to understand when weakness shows up. In the end the Corona crash was visible in one chart, very much hidden, only visible for those that have an advanced crash indicator analysis method.

We already can see that two of our crash indicators will give us an answer THIS WEEK. Both have a short to medium term impact, and one of the two is the ‘xyz’ chart.

We will know, later this week, whether we expect February to start on a bullish or bearish note, suggesting that scenarios 2 or 3 of the ones outlined above are playing out.

Source: Momentum Investing research by InvestingHaven

And our analysis was really spot-on: the retracement in markets started on January 27th, 2021. The next trading day (Thursday) might have been bullish but it turned out to be a dead cat bounce.

We helped our members increase their cash position, and take profits one and two weeks ago. We welcome lower prices because we are always interested in buying quality with a discount.


10-YEAR ANNIVERSARY OFFER: InvestingHaven.com celebrates 10 years. Temporarily, you can enjoy a discount on our premium gold/silver and crypto reports. Or you can become a VIP member. Go to our anniversary deals >>
Receive our weekly newsletter.

premium service SP-500   premium service trade alerts   premium service crypto teaser  

No related posts.

Tags: Dow Jones chartsINDU
Taki T.

Taki T.

Taki is a chart analyst who is passionate about unlocking unique insights out the chart. While the vast majority of analysts remain focused on price analysis, Taki starts with timeline analysis and adds price analysis to this. In doing so, he developed a unique methodology to find opportunities in financial markets, across assets and markets.

Connect with InvestingHaven

Receive top notch forecasts for free.

*We hate spam as you do.

Site Navigation

  • RSS Feed
  • Advertising
    • Sponsored Content Policy
  • Advertising Disclosure
  • Risk Disclosure
  • Privacy Policy
  • Terms of Service
  • Sitemap
  • About us
  • Contact Us
investing haven logo

Precious metals market analysis including gold and silver price predictions. Crypto market analysis including highly accurate BTC ETH SOL XRP forecasts.

Copyright © 2025 InvestingHaven

Login to your account below

Forgotten Password?

Fill the forms bellow to register

All fields are required. Log In

Retrieve your password

Please enter your username or email address to reset your password.

Log In

Receive top notch forecasts for free.

*We hate spam as you do.

The views and opinions expressed in this article are solely those of the author and do not necessarily represent the official position, policies, or views of InvestingHaven or its affiliates. This content is provided for informational purposes only and does not constitute financial, investment, legal, or other professional advice. Readers are advised to conduct their own research and consult with a qualified financial advisor before making any investment decisions.

No Result
View All Result
  • 2026 Forecasts
    • 10 market predictions
    • Dow Jones forecast 2026
    • S&P 500 forecast 2026
    • Nasdaq prediction 2026
    • Best crypto to buy now
    • Which crypto will explode
    • Best altcoins to buy
    • 15 crypto forecasts 2026
    • Which precious metal to buy
  • Silver articles
    • Silver prediction 2026 – 2030
    • Can silver hit $100?
    • Silver shortage
    • 50-year silver chart
    • Silver bullish reversal
    • Silver seasonality charts
    • How to invest in silver
  • Gold
    • Gold prediction 2026 – 2031
    • Will gold set new ATH?
    • Can gold hit $10,000?
    • Gold chart 10 years
    • Gold chart 50 years
    • Gold chart 100 years
    • Gold silver ratio
    • Gold seasonality charts
  • Commodities
    • Sugar forecasts
    • Coffee forecasts
    • Nickel forecasts
    • Lithium investing
  • Crypto forecasts
    • BTC prediction 2026 – 2031
    • ETH prediction 2026 – 2031
    • SOL prediction 2026 – 2031
    • XRP prediction 2026 – 2031
    • XLM prediction 2026 – 2031
    • BNB prediction 2026 – 2031
    • ADA prediction 2026 – 2031
    • AVAX prediction 2026 – 2031
    • KAS prediction 2026 – 2031
    • NEAR prediction 2026 – 2031
    • BCH prediction 2026 – 2031
    • LINK prediction 2026 – 2031
    • DOT prediction 2026 – 2031
    • SUI prediction 2026 – 2031
    • ICP prediction 2026 – 2031
    • LTC prediction 2026 – 2031
    • STX prediction 2026 – 2031
    • DOGE prediction 2026 – 2031
    • SHIB prediction 2026 – 2031
    • PEPE prediction 2026 – 2031
    • FLOKI prediction 2026 – 2031
    • WIF prediction 2026 – 2031
    • ONDO prediction 2026 – 2031
  • News
    • Crypto news
      • Bitcoin
      • Ethereum
      • XRP
      • Solana
      • Dogecoin
      • Cardano
      • Litecoin
    • Commodities & Gold
      • Gold
      • Silver
    • Markets & Stocks
  • Premium Crypto Alerts
  • Premium services

Copyright © 2025 InvestingHaven