Leading indicators are all that matters for analyst-investors like ourselves. That’s not to be confused with technical indicators which are lagging and not predictive. But which leading indicators are relevant and how to read them? Although the answer to this question is too long (please find some pointers in our guide 100 Investing Tips) we look at one specific leading indicator in this article: the Russell 2000. Its setup certainly confirms our viewpoint which is that markets eventually will resolve higher although the summer rally might be close to hitting resistance!
In 7 Secrets of Successful Investing we mentioned that success rule #1 is about emotions. The fact is that emotions lead to bad decisions.
Do you remember what was happening in June, just 2 months ago? Depressed sentiment among investors hit the lowest point since WW2.
That’s correct, the worst sentiment in 8 decades. The problem, back in June, was that headlines were so fear mongering that nobody could ever imagine the market decline would ever end.
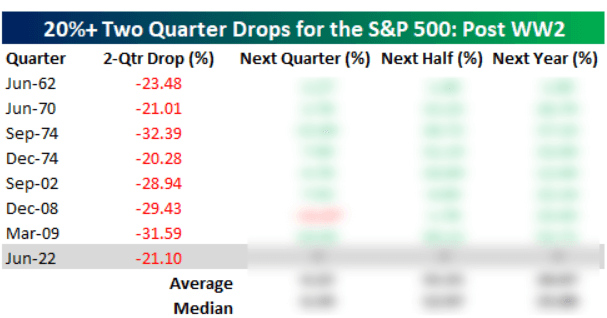
While the 2 consecutive quarter drop, in % points, was not the worst in the last 8 decades, it certainly was the single worst moment in time when it comes to sentiment and fear.
Below is the 2 consecutive quarter performance of the S&P 500. The Dow Jones was somehow similar, the Nasdaq and the Russell 2000 worse.
Back then, we made the point that investors should hold, not sell, provided they hold quality assets.
And that’s why it’s so important to control emotions, as per the first point we made above. With emotions in extremely pessimistic territory we must avoid, as investors, to let emotions influence decisions. No emotions when investing!
Many investors have sold the bottom, we know this for sure. At Momentum Investing, we recommended to DO NOTHING as a portfolio strategy!
There were many reasons why we considered holding, not selling, one of which was the inability of volatility indexes to print higher highs. Here is another reason: the Russell 2000, acting as a leading indicator for stock markets, hit its previous highs at 1696, our downside target.
Look what happened since then. Quite a bullish reversal, isn’t it.
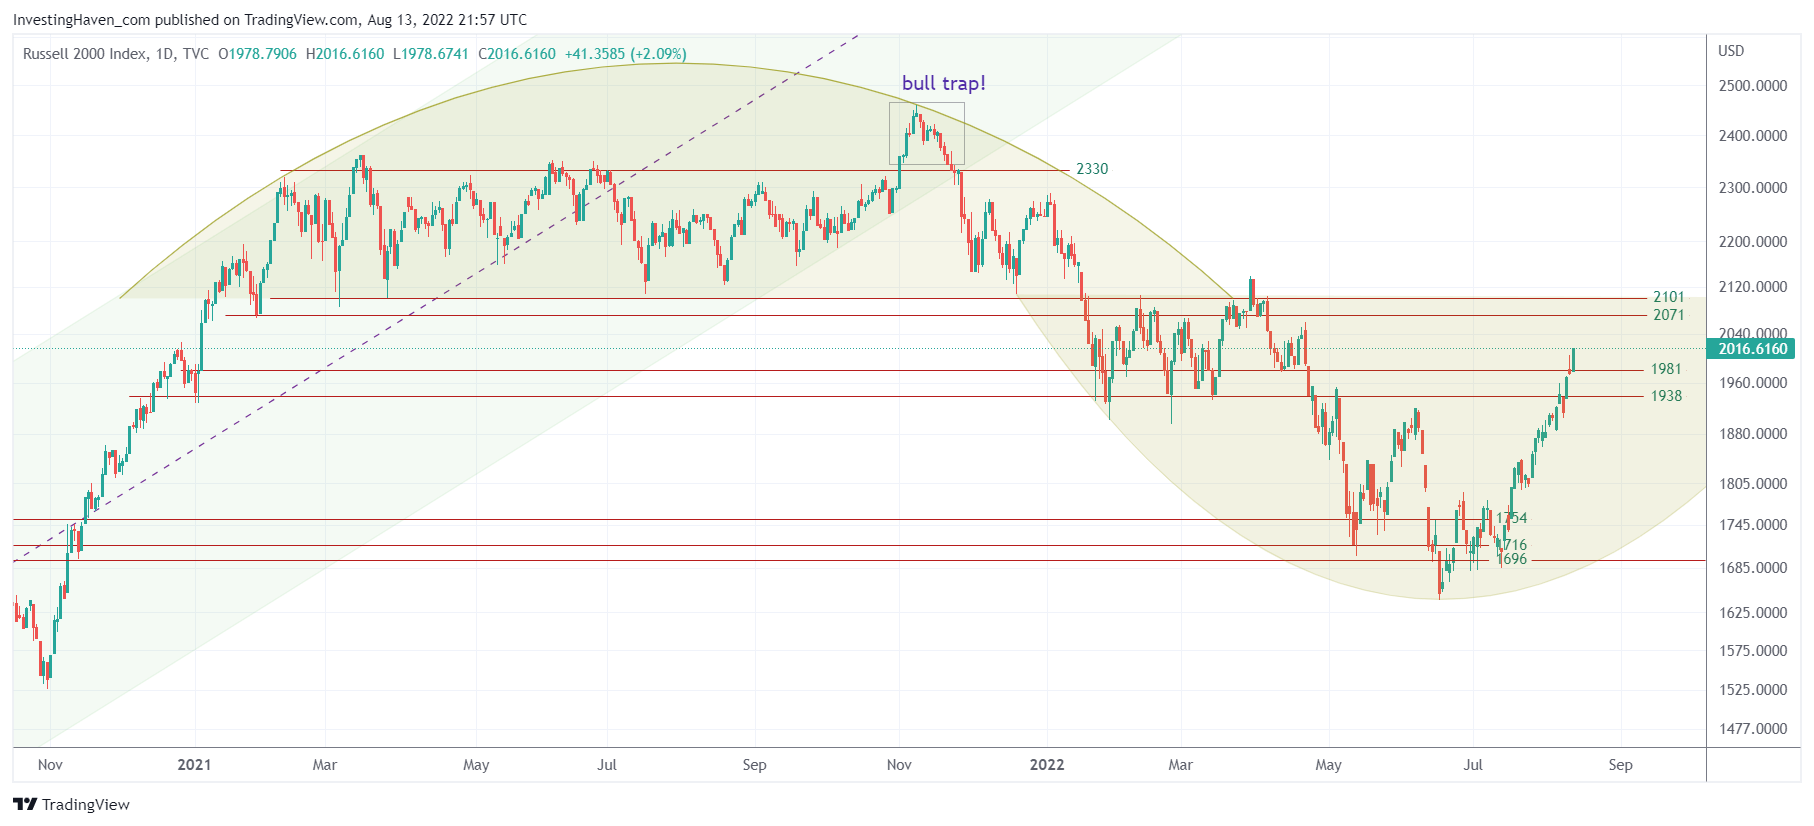
We believe this structure in the Russell 2000 is the one we need to be tracking, going forward, to understand the intention of the market.
For now, we believe that 2101 points could be the upside target after which the summer rally takes a pause.
We like the structure of this leading indicator, a lot, because it gives us a very specific structure to work with, particularly the rounded patterns are easy to track as soon as they start showing up.
Note that in our Momentum Investing portfolio we went overweight in one particular semis stock, in Q2/2022. It is the only semis stock that closed at ATH on Friday. Moreover, in our Trade Alerts weekend analysis on July 16h we spotted the start of the summer rally on the day it started. Our proprietary volatility analysis is very powerful and also predictive, a must read component in anyone’s methodology.


