
Markets are hitting resistance. No surprise, there was a nice rally since the banking crisis appeared to be a ‘non-event’. It was only a meaningful event for a few regional banking stocks that completely crashed and a few banks that went under). In this weekend’s Trade Alerts analysis, we reported a divergence between leading indicators and stock indexes.
Whenever there are divergences in leading indicators (especially the ones that are predictive by nature), we do pay attention.
We said it over and over again, we don’t pay attention to headlines as they are lagging:
Is Dr. Copper As Concerned About The Economy As Experts?
Are Economic Experts Lying Or Confused Or Both?
The Market Will Not Move 50% Lower Contrary To What The Gurus Are Telling You
It’s the message of leading indicators that is of importance, certainly when they show divergences!
That said, we are going to include a few quotes from our premium weekend analysis, which we do from time to time to give our readers the opportunity to understand ‘what’s inside‘ our research & trading service Trade Alerts.
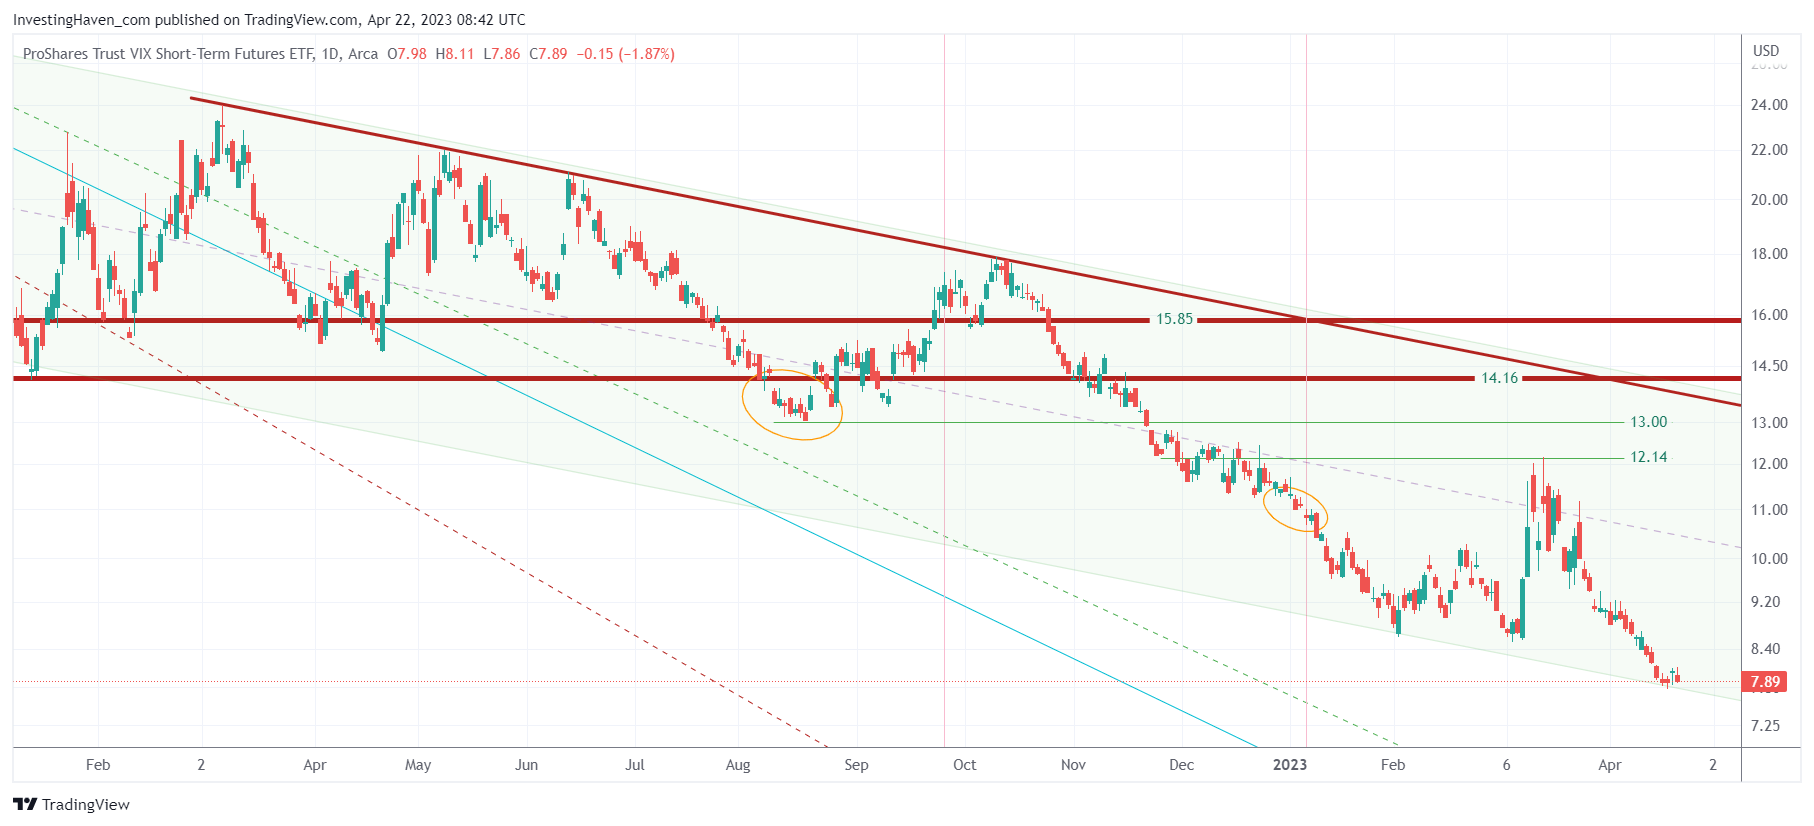
Below is an excerpt of our proprietary volatility index analysis:
The short term volatility index seems to be hitting 14 month support. This would be consistent with a local top reading at 4200 points in SPX. The probability of a lower low in this volatility index is rather low, it might happen but it would imply the channel we currently have on our chart would be somehow steeper (down).
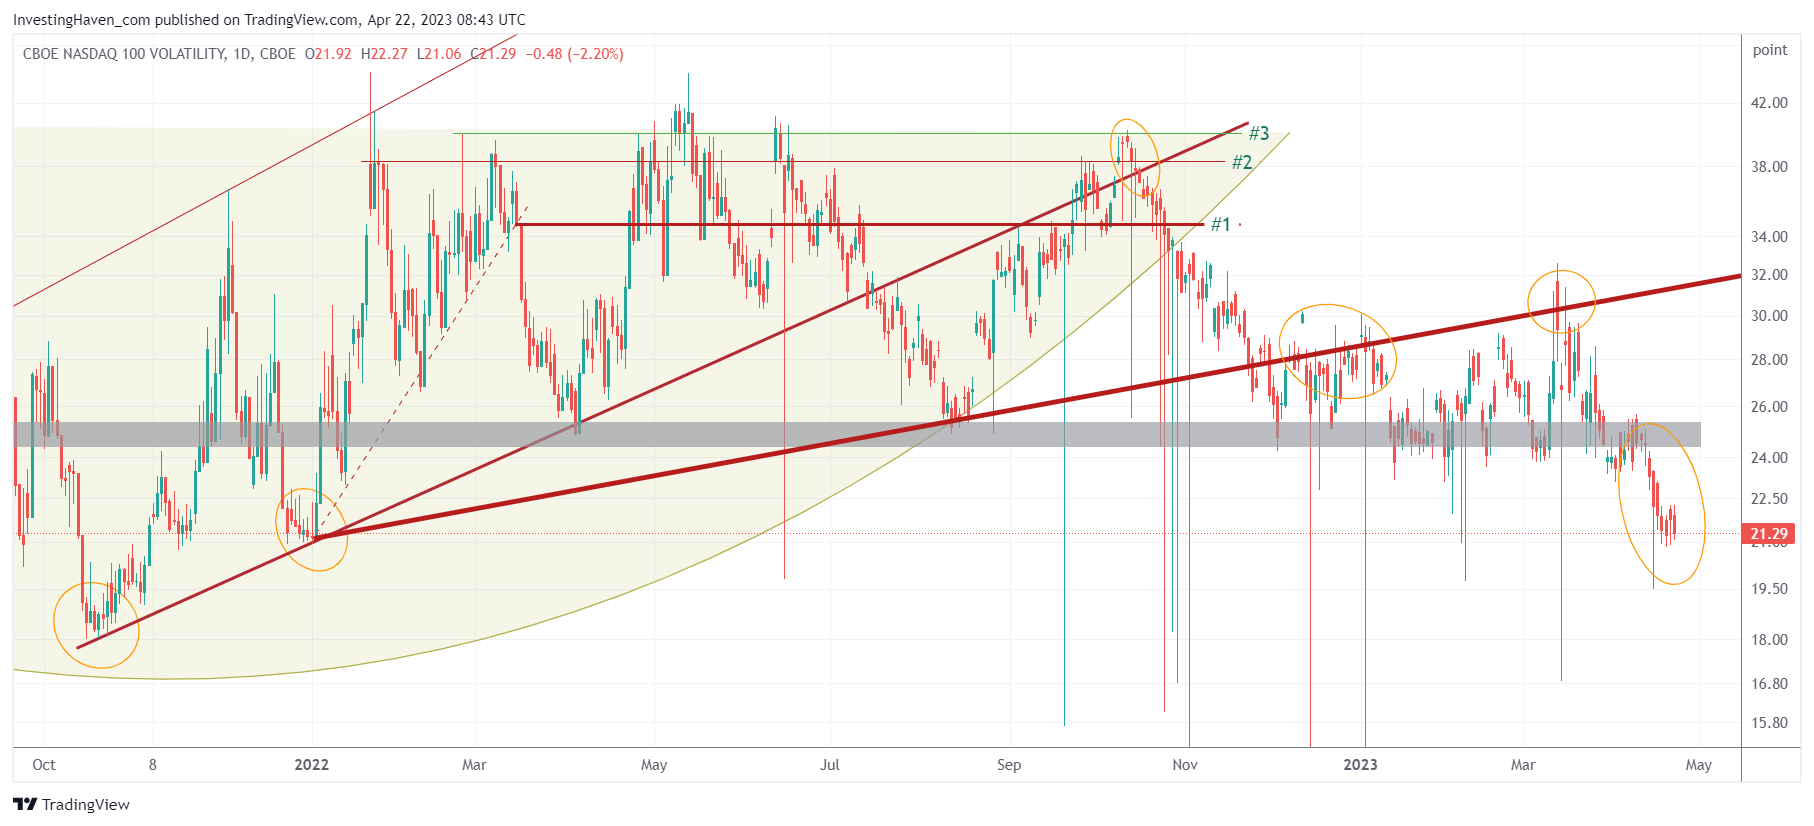
The Nasdaq volatility index is setting lows, well below the 2022 support level, without the Nasdaq clearing resistance. This is a divergence. Mostly, the volatility indexes tend to be right. Let’s put it this way: if the Nasdaq is able to clear its recent resistance, it would confirm the accuracy of the volatility index. In that scenario, a higher bullish target will be set in the first week of May.
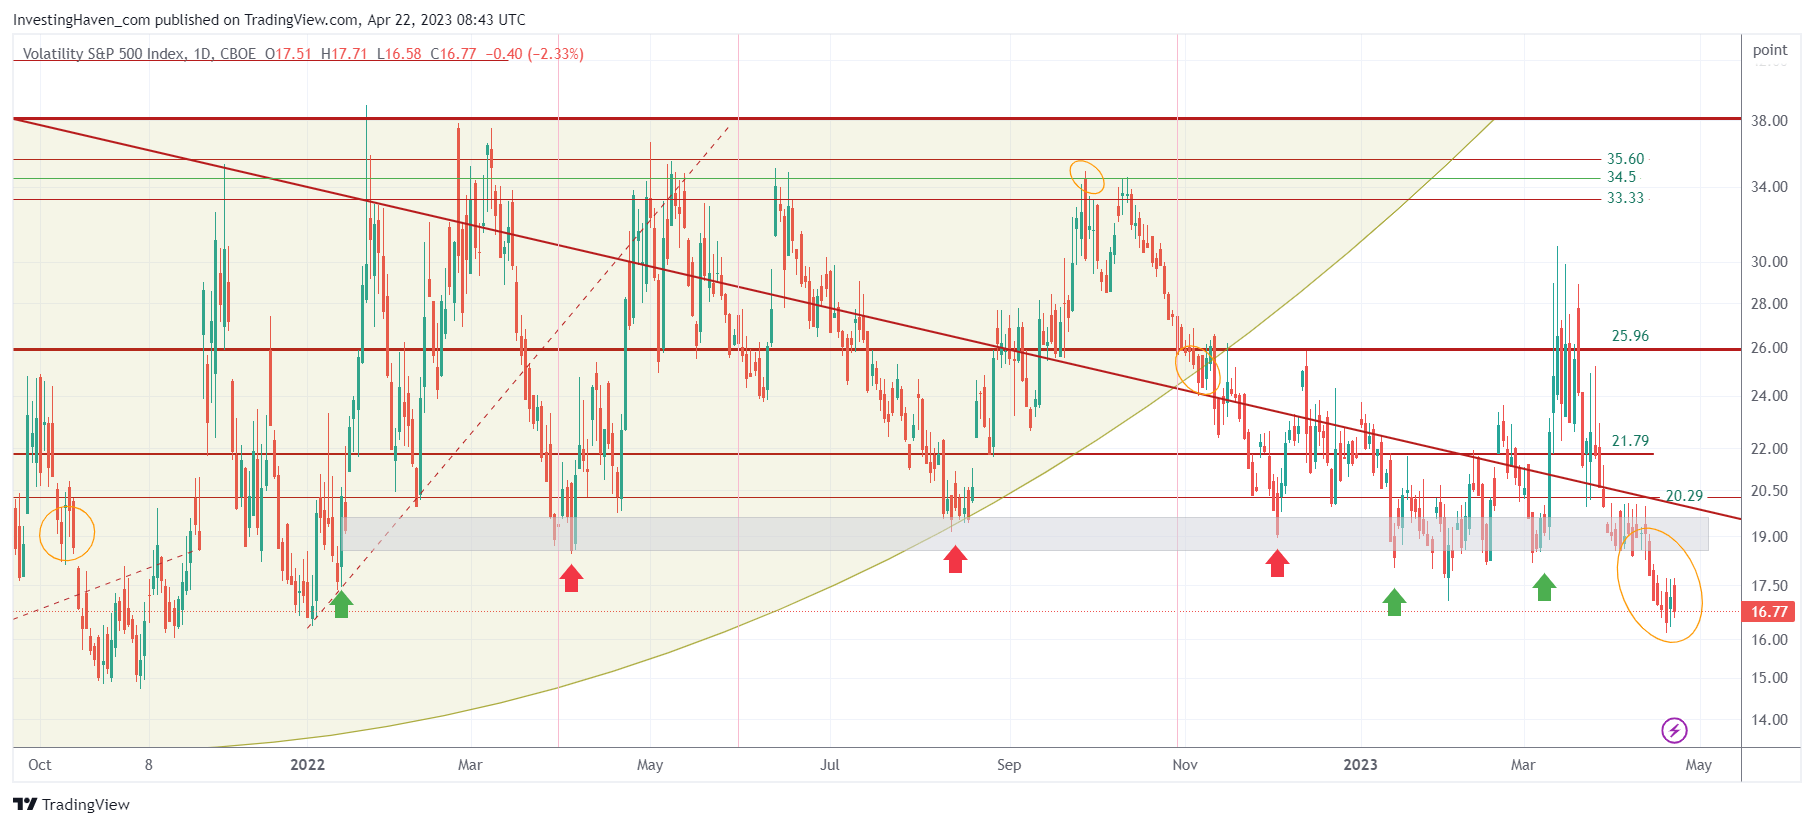
Similarly, VIX, the S&P 500 volatility index, is setting a new low without SPX clearing resistance. It’s a divergence, we pay attention. Either SPX moves to 4300 in the first week of May, or 4200 is the local top before a corrective wave starts.
The expected volatility of VIX, which is VIX of VIX, had a few strong days pushing this index back to 100 points. The other volatility indexes, above, did not follow. Another divergence. We pay attention, throughout the coming week we will have an understanding who is leading: VIX of VIX, volatility indexes, stock indexes.
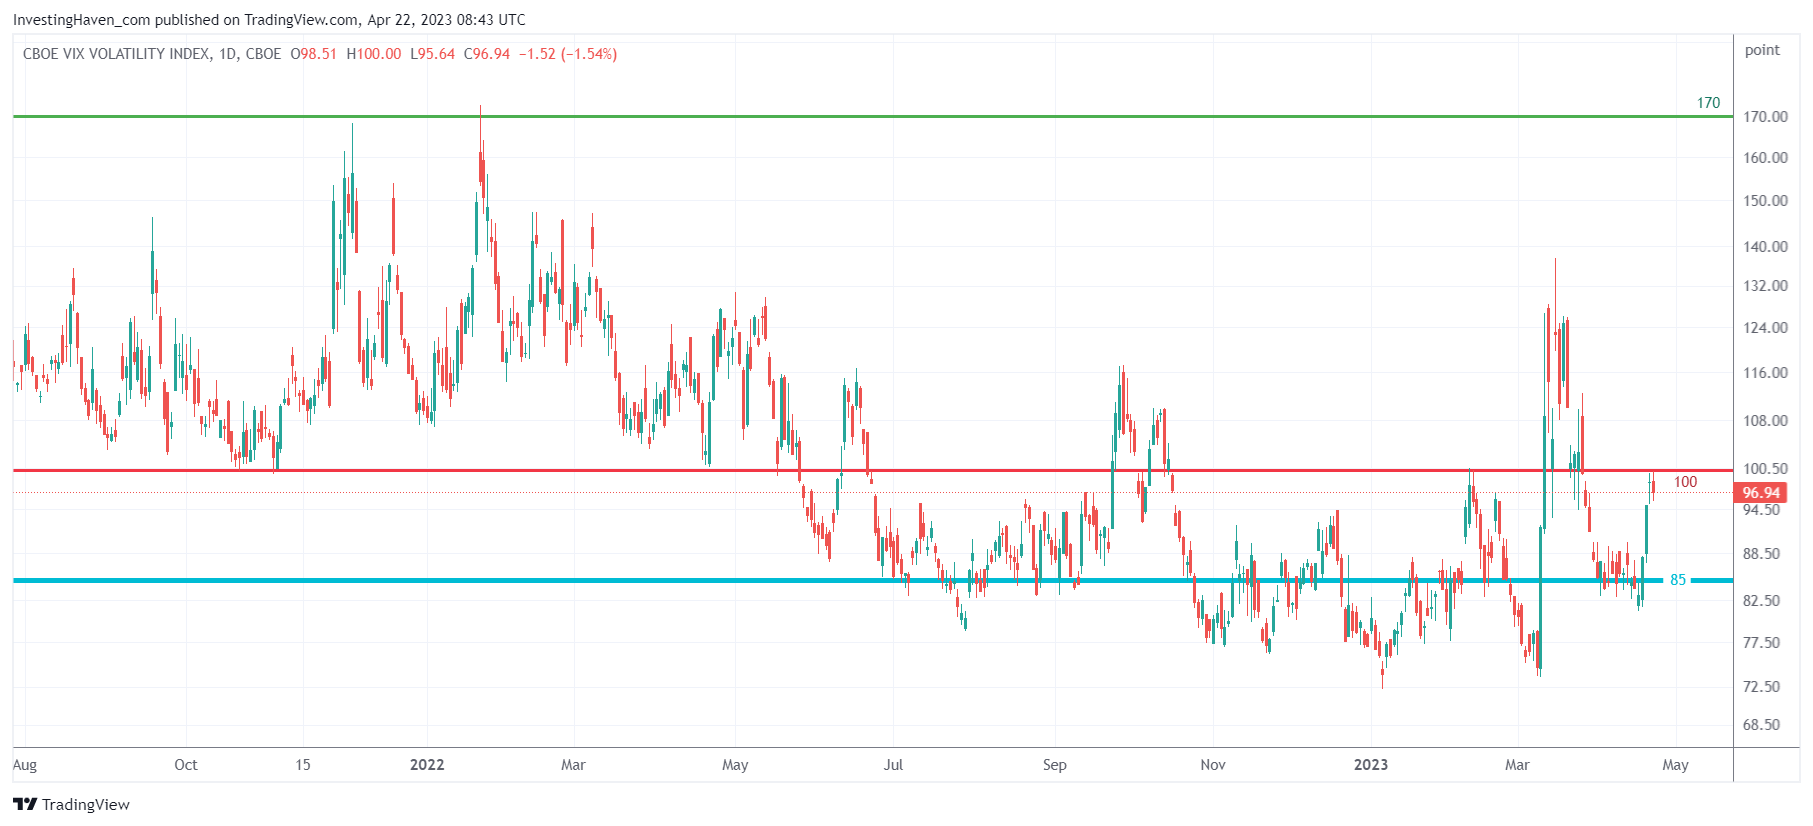
Conclusion (1) There is a divergence between VIX of VIX, volatility indexes and stock indexes.
Conclusion (2) Next week will be very clear: either recent resistance in SPX & the Nasdaq are the local top OR a slightly higher low is in the cards before a corrective wave starts.
We expect a local top to be set in the first week of May, the only question is whether this local top will be set at recent resistance or slightly higher.
Note that our SPXL/SPXS auto-trading portfolio is growing, it registered its highest value (in absolute dollar value) since inception. We keep on emphasizing it to our members: this is just beginning. We remain humble and heads-down until we have achieved compound portfolio effect, a major milestone we are working towards for our members! The compound portfolio effect kicks in when portfolio growth reaches approx. 75% (excl. fees). The dynamics will be entirely different as of that point.
Sign up for or ask us a question about auto-trading SPXL/SPXS >>


