It is starting to get serious. The number of ‘gurus’ out there that are turning bearish is almost getting ‘out of hand’. If the ‘gurus’ say so we must listen right? Well, if anything, we listen to our charts, not the ‘gurus’. Because it is proven that listening to gurus is going to deflate your wealth. There are various reasons for this, which go beyond the scope of this article. All we will do in this post is forecast that no market crash is imminent. Moreover, our charts make the point that our 2021 forecast is: no market crash.
One of the many articles out there that make you wanna sell all your stocks instantly is this one:
Michael Burry, Jeremy Grantham, and other top investors are predicting an epic market crash.
So, let’s neutralize emotions. Let’s look at leading indicators, and try to understand the message of the market.
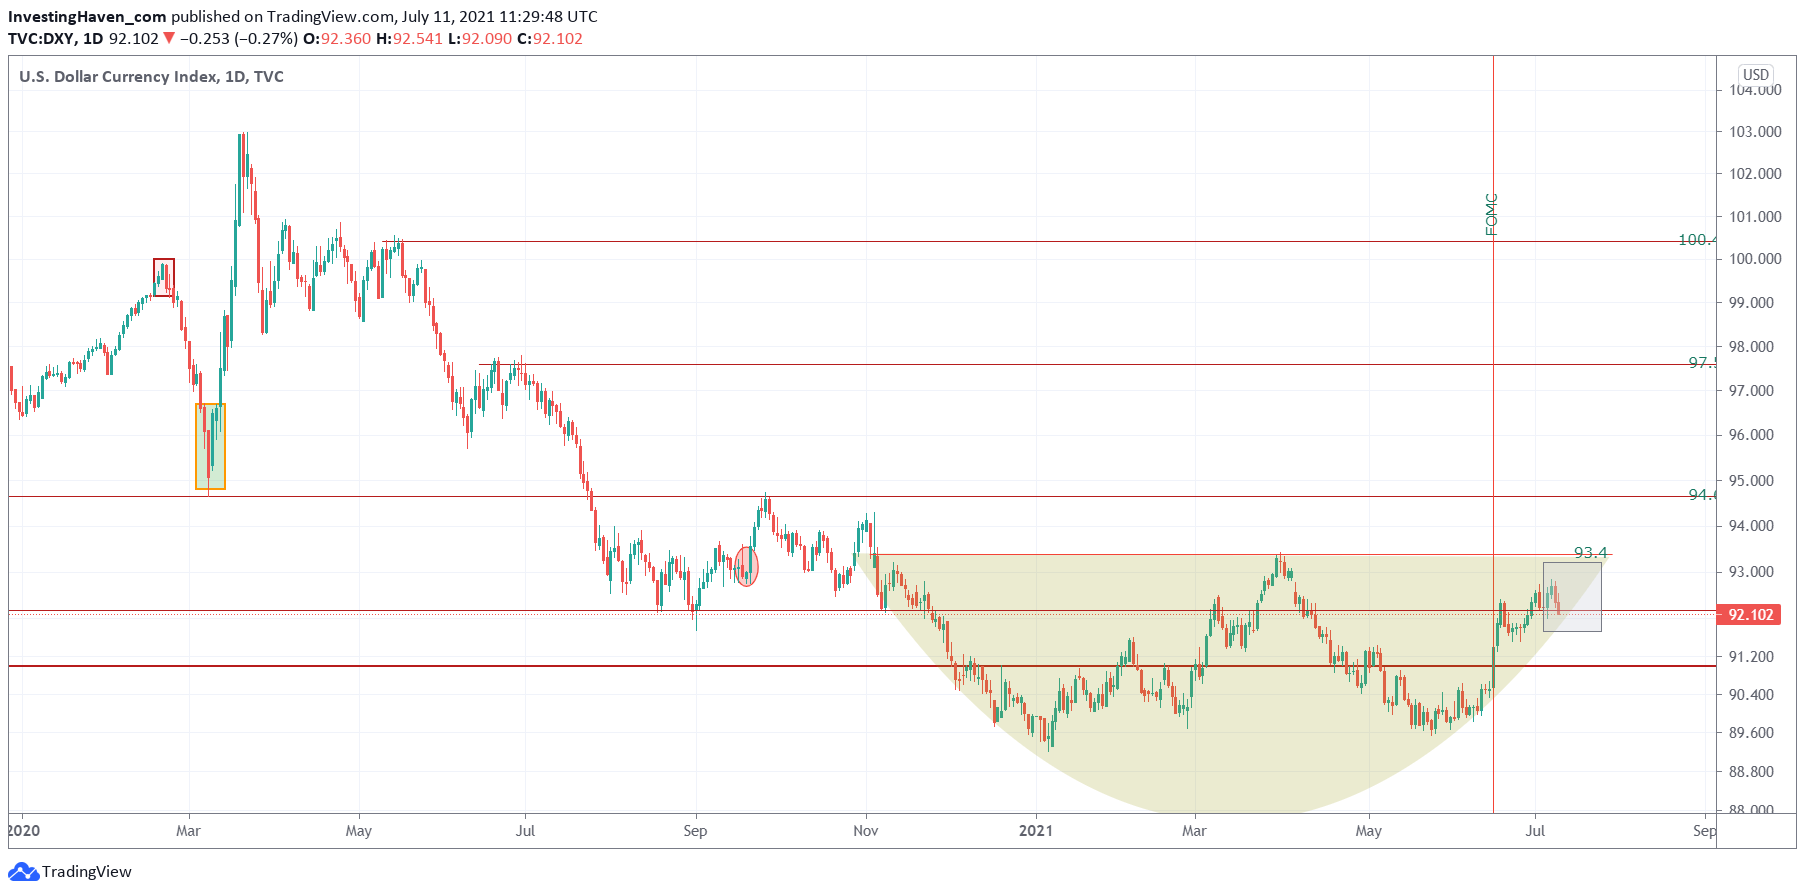
First, the USD.
Yes, definitely a bullish setup with a solid W reversal. It can create damage, for sure. It is highly deflationary if it continues to rise. And that’s the whole point: all our charts point to inflation, not deflation. Think CPI, unemployment, spending, and a dozen of other economic indicators. Monetary policies are highly inflationary, not deflationary. We don’t see the USD break out, we might be wrong.
From a chart perspective we believe the 2020 decline was too strong and requires a larger consolidation in order for the USD to corner markets.
In sum, we don’t see the USD more to +100 points which is one of the scenarios to trigger a market crash. Certainly not in 2021.
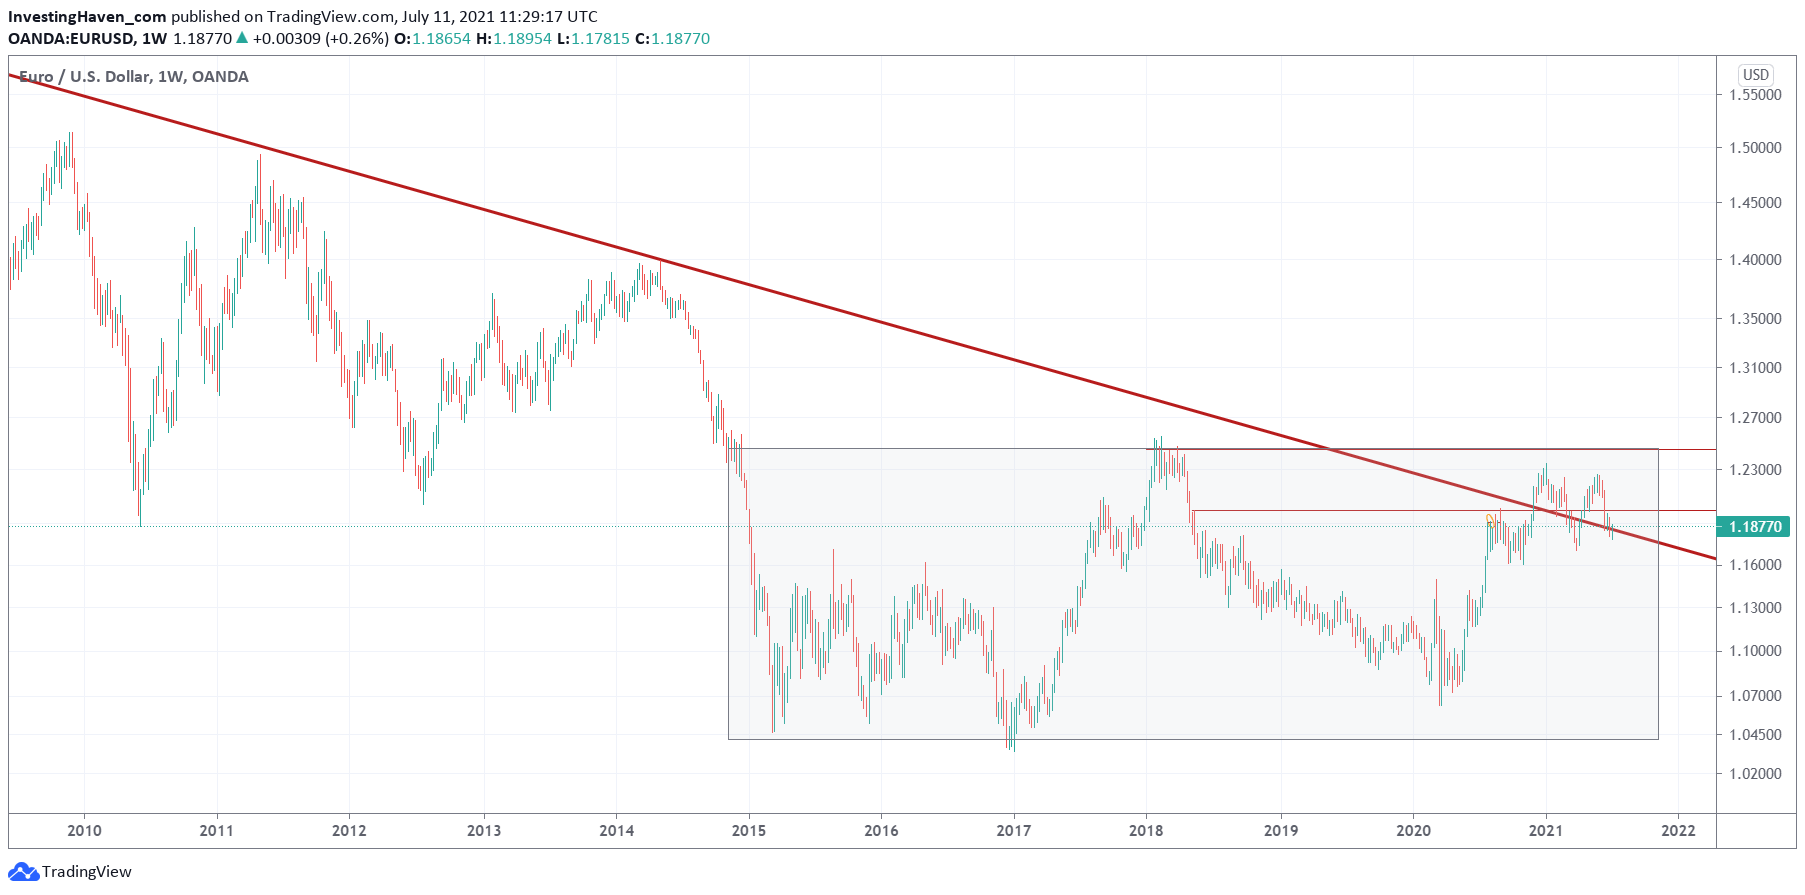
On the flipside, the Euro is now testing a breakout of a 10-year bear market trend. The breakout took place in December, 7 months ago. The Euro technically has broken out, and is testing key levels in the context of a giant bullish reversal. This is not a setup for a market crash!
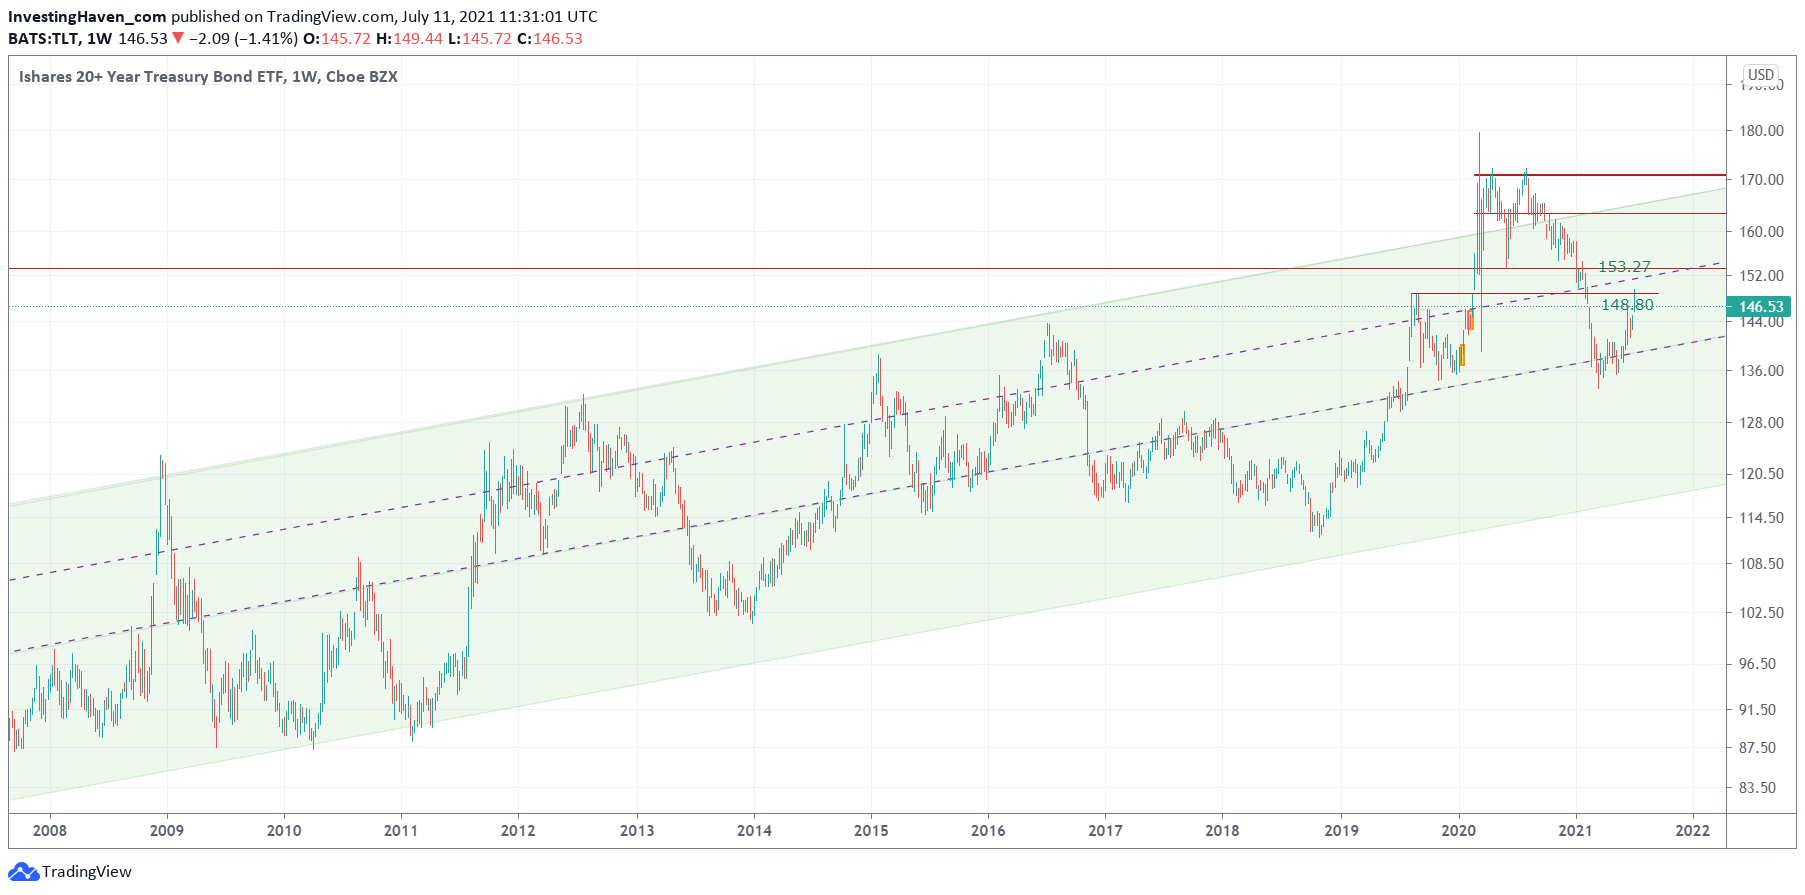
Treasuries always react fast (higher) when market are about to crash.
While TLT (20 year Treasuries) have been moving higher recently, it looks like they are hitting a strong resistance now. Only in case TLT will move strongly higher from here will we be concerned. While we don’t want to exclude any scenario it looks like the lower probability scenario right now. Until proven otherwise, Treasuries have limited upside potential and will not induce a market crash.
Last but not least the S&P 500 accelerated its bull market in December last year. Surprise surprise, it happened in the same month as the Euro broke out of its 10 year bear market.
The S&P 500 is now in a confirmed breakout area. The thick red trendline makes this point. And it is the first time since 2008 that it trades above this trendline.
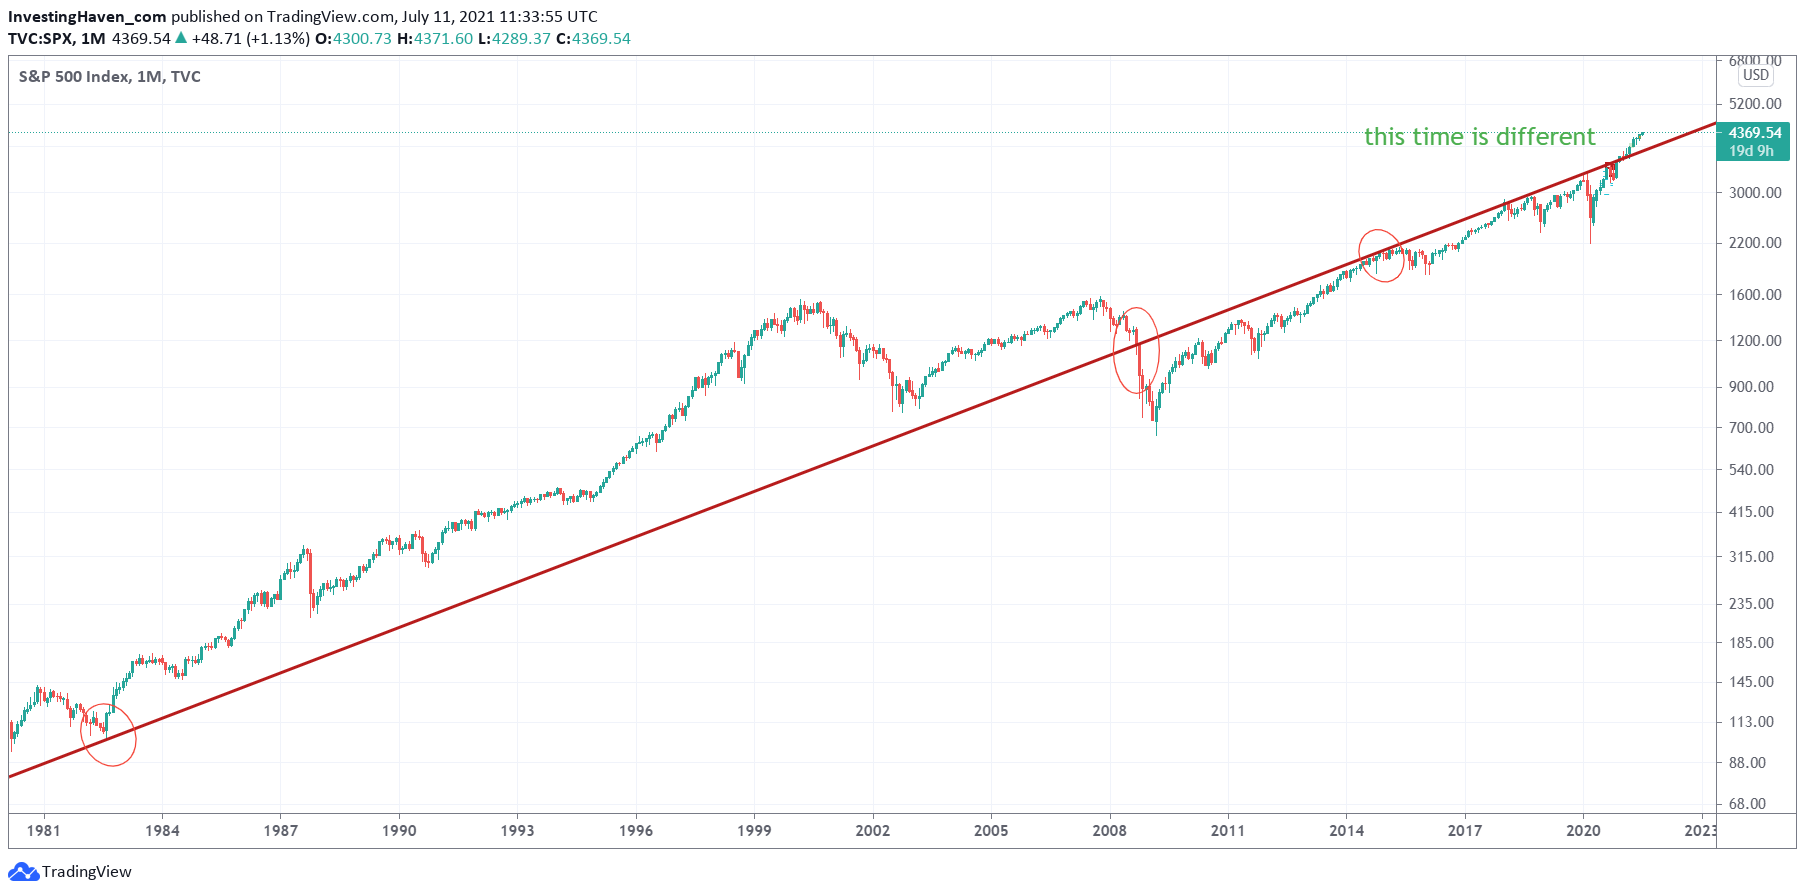
If anything, this looks like a highly inflationary and ultra bullish environment, not a market crash type of situation.
While we don’t exclude regular retracements, even up to 10% in leading indexes, we don’t see a market crash coming soon.
Moreover, 200 years of stock market history has shown that severe stock market crashes take years to develop. They don’t occur one or two years after each other. It takes at least 4 to 7 years for a next crash to start.
We have confidence in our charts and market readings, not in guru story telling articles.


