The market closed another quarter with lots of volatility. The summer rally lasted some 4 to 5 weeks and pushed stocks much higher. However, the subsequent decline brought indexes back to their June lows. Is this the start or the end of selling?
While we cannot answer the last question with 100% certainty we do know that selling is really stretched.
Our detailed weekend analysis in our Momentum Investing service features one data point that comes out of our research team: selling pressure.
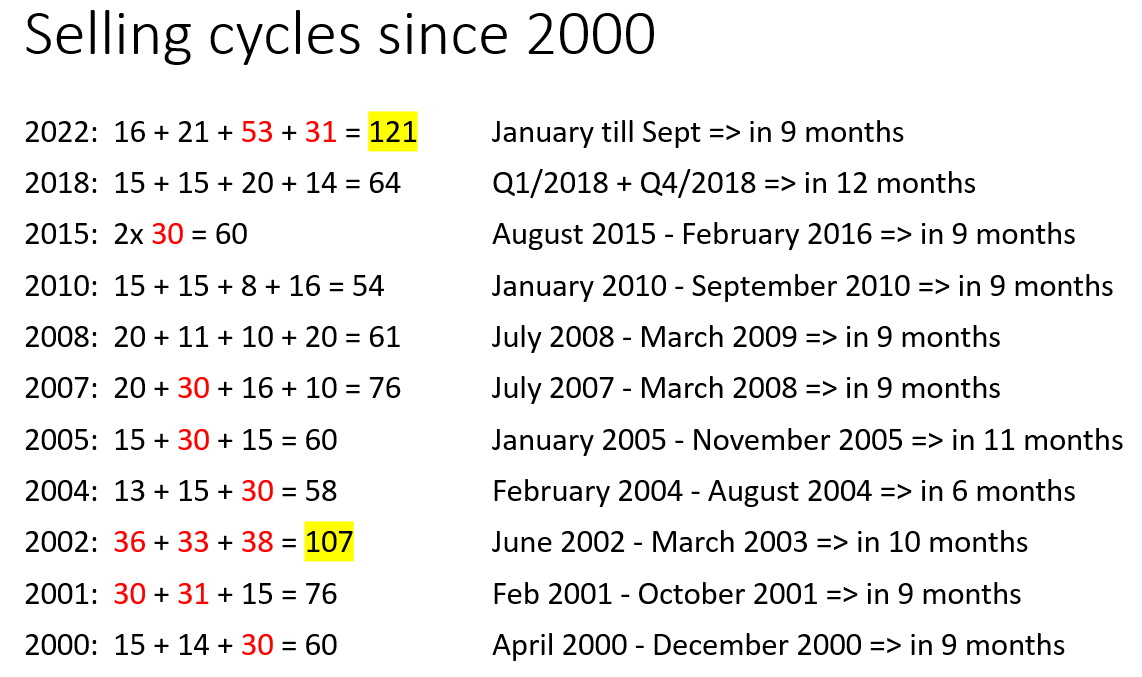
Below is a table that highlights the number of days in selling cycles that occurred in the last 22 years. Remember, the big stock market crashes of 2001/2002, 2008, 2018, 2022 all occurred in this time period.
With ‘selling cycles’ we mean very intense periods of selling. Typically, those selling cycles tend to last a few weeks, very exceptionally they last 5 weeks or more. Selling cycles that lasted more than 5 weeks are annotated in red below.
If we look at selling intensity as a stretch indicator, we see that this last selling cycle lasted 31 days. In 2022, we completed 4 waves of selling, as seen below, with a total count that exceeds selling pressure in every year since 2000.
Below table features daily counts clustered per selling cycle in each year.
While some may compare 2022 with the 2008 bear market we see that the pace of the decline in indexes in 2022 is faster than in 2008. The Russell 2000 is down 33.0% in 10 months, SPX is down 25.7% in 9 months. Moreover, and equally important, 2022 is characterized by heavy rotation: sectors are selling off in waves. This means that the first sector to sell off which is technology is the one to hold up better (in relative terms) as commodities / materials / energy / industrials have been selling harder in September.
This last point is the core of our risk vs. opportunity assessment, going forward: if tech stocks hold up and the market will soon complete its rotation between sectors, giving space to tech to move higher, it might mean that we are very close to the lows. This would suggest a major buy opportunity is in the making.
However, if the sector rotation dynamic is about to result in a general decline (which we don’t expect but cannot exclude neither) it means the opportunity is further out in time because markets need to bottom out at a lower level.
This article is a short excerpt from our lengthy market analysis shared in today’s Momentum Investing research service. From time to time, we feature an excerpt from our research work. Note that this is a very short excerpt, we cover many indicators / sectors / markets / stocks in our weekend analysis and stock list(s).


